Common word-processors display text tables with ample blank space. It takes skillful maneuvering of row heights and column widths and an extra minute or two for the user to produce a more space-efficient table. That this optimization process was not automated frustrated me and posed an interesting challenge.
Explained and pasted below are the algorithms I developed, which can be implemented with any Text Grid object in the Wolfram Language.
Defining the Problem
I first defined the objective as determining the best column widths to minimize the area of a text table with set amounts of text in each cell. More formally:
Note: 'Blurb' is the label I use for the text in a cell, but represents a continuously changing blob of area rather than words with finite line breaks.
Given:
- a two dimensional table
- its of rows and columns,
- that the area of each cell's blurb (amount of text) is constant
- that the width of each column is variable,
- that the height of each row (a function of the column widths and blurb areas) will be as small as possible while still fully showing each of its cells' blurbs
- that the aspect ratio of each blurb can be any value consistent with its cells row and column constraints,
Determine the column widths that minimize the tables area.
I quickly realized that these specifications yielded an imperfect solution; the column widths that 'solve' this problem cause the tables width to approach zero as the height approaches infinity. Such narrow dimensions would produce very long single lines of text in each cell, which is not the aesthetic result I wanted.
In response, I made the total width of the table constant (presumably equal to the width of the page given), which ensures that the table won't extend enough to be unreadable.
A good way to visualize the problem is a plot for a 2x2 table that shows the relationship between the first column width (which is the only parameter, as the second column can be written as TotalTableWidth-FirstColumnWidth) and the table's total area. The graph below displays this relationship for a sample random distribution of text in each cell.
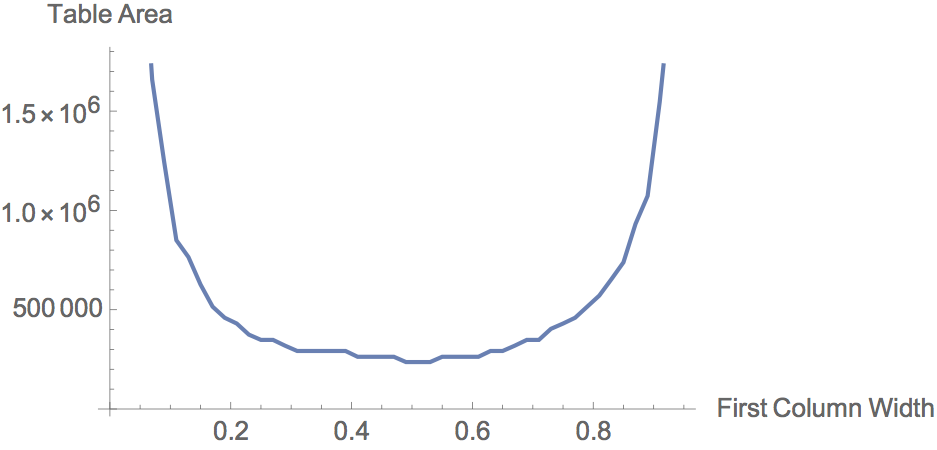
The shape of this almost-parabolic, upward-facing function indicates that there is one column width at which the total area of the table is minimized. From the plot, this point seems to occur when the first columns width is just over 0.5 of the total table width.
Unfortunately, the expression used in this plot to calculate the area of the table given the column widths is badly suited for the desired minimization algorithm because it involves rasterizing the grid at each column value, occupying an infeasible amount of memory and time for any table of more than two rows and columns.
Developing Algorithms
Before digressing into the details of the algorithms I designed, let me make note of an important assumption. In reality, any dataset of text to be displayed in a table is discrete; each cell has a limited number of aspect ratios due to there being a finite number of words and ways that the text can be 'line-breaked.' In constructing the algorithms below, I idealized the blob of text in each cell as a continually adjustable entity. Doing so allowed me to apply the calculus-based techniques of continuous optimization problems rather than those more complicated ones applicable to the discrete world. The only foreseeable con of this approach (one that Ive learned to be actual), is that there are occasional instances in which the solution is not ideal
TextConstrict Function
From the aforementioned constraints of the problem, it is easy to see that the height of the data in each cell (i.e. the number of lines it occupies) is the data's total area (number of characters) divided by the width of its column, shown in a table below for row i and column j.
Table[
  StringLength[
    contents[[i, j]]] (*The number of characters in a given cell [[i,j]]
    /colwidths[[j]], (*The width of column j*)
{i, Dimensions[contents][[1]]}, {j, Dimensions[contents][[2]]}]
Hence, the height of a given row (an array of these cells) will be the maximum of the heights of the data in its cells.
height = Map[Max, Table[
  StringLength[contents[[i, j]]]/colwidths[[j]], {i,
   Dimensions[contents][[1]]}, {j, Dimensions[contents][[2]]}], 2]
For a table of constant width, minimizing its height is equivalent to minimizing its area. Hence, the expression above for the height of the table can be plugged into the NMinimize function to yield the best arrangement of column widths. As constraints, we must ensure that:
- every column width is larger than zero
- the sum of the first j-1 columns is less than the table's total width
NMinimize[{
  height,
  Flatten[{0 < Total[adjustablewidths] < 1 - .01,
    Table[col[i] > 0, {i, dimens[[2]] - 1}]}]}, adjustablewidths
 ]
This process, which I amalgamated into the TextConstrict function, optimizes a table's dimensions almost perfectly yet is sometimes slow. Below is the entire function.
TextConstrict[contents_List] :=
 Module[{ dimens, datatable, adjustablewidths, colwidths, height,
   solutions, params, sizes, col},
  dimens = Dimensions[contents];
  adjustablewidths = Table[col[i], {i, dimens[[2]] - 1}];
  colwidths =
   Append[adjustablewidths, Subtract[1, Total[adjustablewidths]]];
  datatable =
   Table[StringLength[contents[[i, j]]], {i, dimens[[1]]}, {j,
     dimens[[2]]}];
  height =
   Total[Map[Max,
     Table[StringLength[contents[[i, j]]]/colwidths[[j]], {i,
       Dimensions[contents][[1]]}, {j, Dimensions[contents][[2]]}],
     2]];
  solutions  =
   Table[Divide[col[i] /. #, 1], {i, dimens[[2]] - 1}] &@NMinimize[{
       height,
       Flatten[{0 < Total[adjustablewidths] < 1 - .01,
         Table[col[i] > 0, {i, dimens[[2]] - 1}]}]}, adjustablewidths
      ][[2]];
  params =
   Sequence @@ ({#, .01, Min[2/Sqrt[dimens[[2]]], .75],
        ControlPlacement -> Top} & /@
      Table[{adjustablewidths[[i]], solutions[[i]],
        StringJoin["Column " , IntegerName[i], " width"]}, {i,
        dimens[[2]] - 1}]);
  sizes = Scaled /@ colwidths;
  With[{$sizes = sizes, $params = params},
   Manipulate[
    TextGrid[contents, Alignment -> {Center}, ItemSize -> {$sizes},
     Frame -> All], $params
    ]
   ]
  ]
Examples
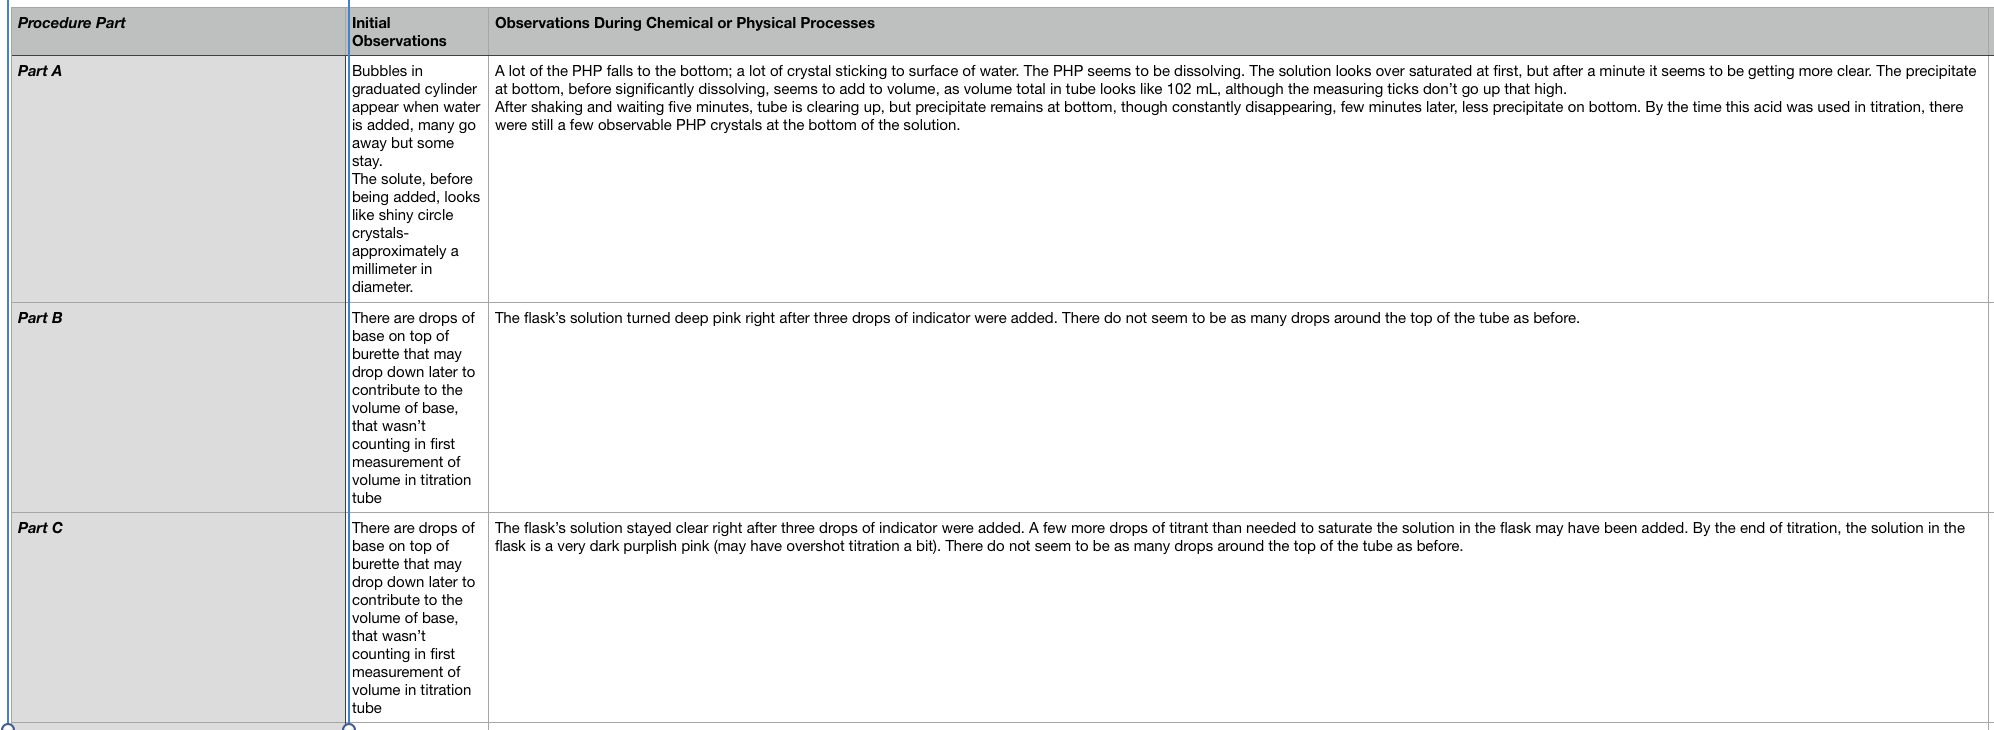
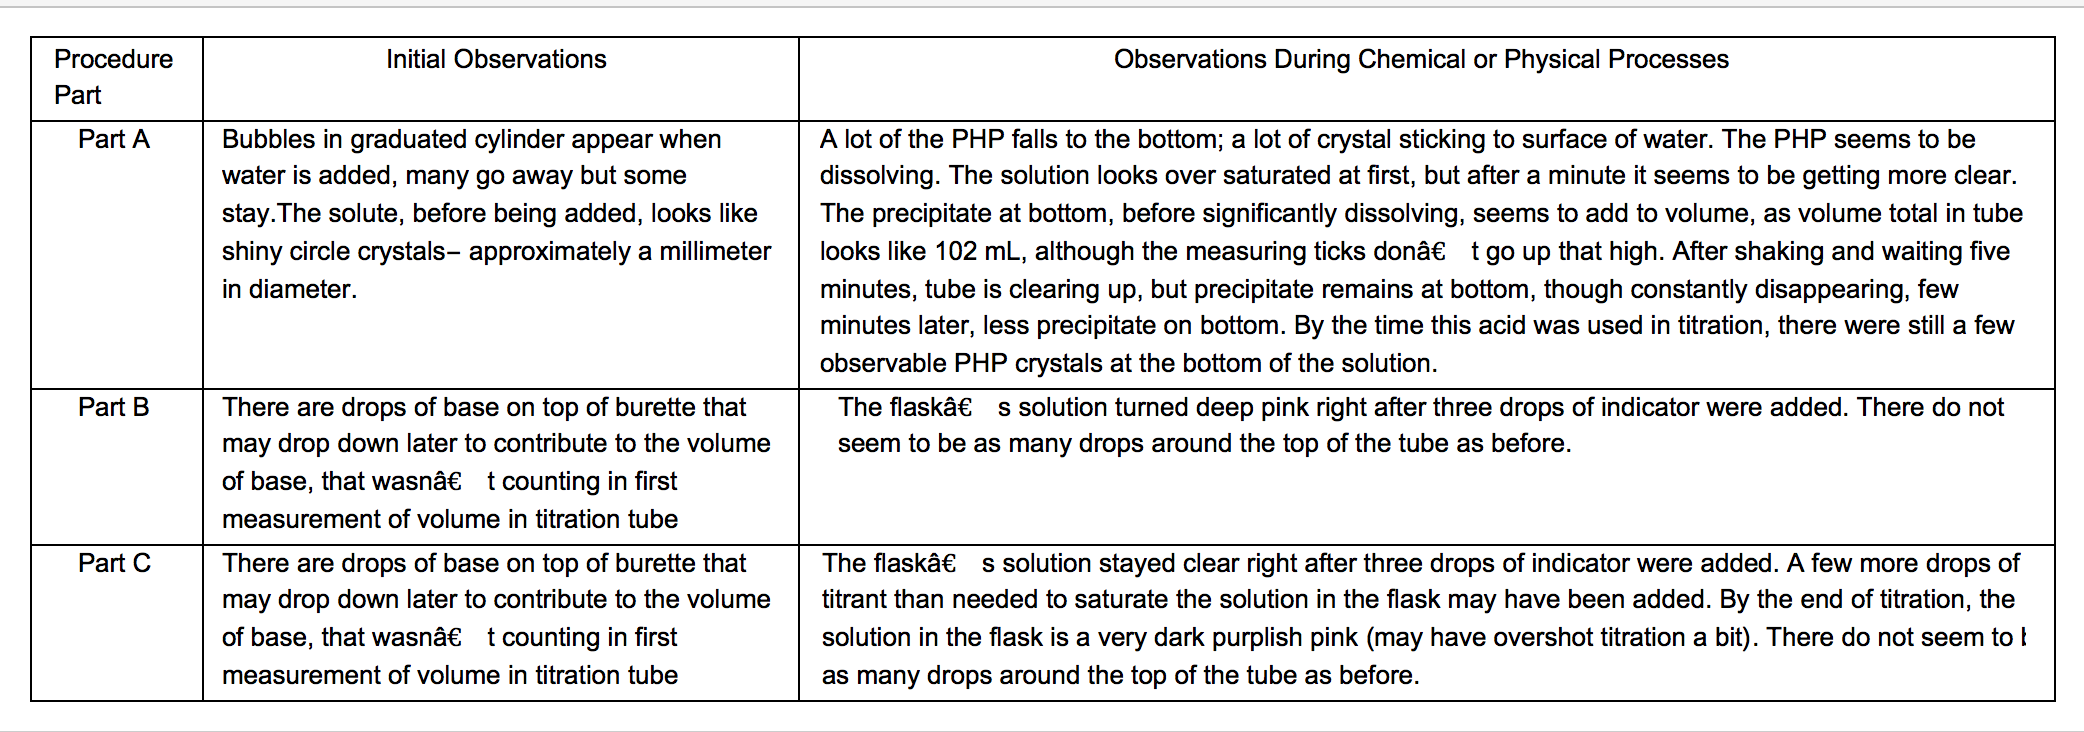
Below are before-and-after images that demonstrate the way in which TextConstrict optimizes the table for a sample dataset;
TextSurround Function
Although not guaranteed to find the best possible column widths, the TextSurround function is a simple algorithmic approximation that comes very close. After initializing the column width parameters in an identical fashion to TextConstrict, TextSurround then calculates the average number of characters per cell in each column. Then, it sets the ratio of the widths of each column to be the same as the ratio of their average character number per cell. In the code below, optimalcolwidths is a table of sums of characters in each column and solutions, which is the set of optimal column widths, is set equal to the fraction of total characters in the table that a specific column possesses.
colsums =
  Table[Total[Transpose[datatable][[i]]], {i, dimens[[2]]}];
solutions  =
  N[Drop[optimalcolwidths, {dimens[[2]]}]/Total[optimalcolwidths]];
Hence, the solution column widths are directly proportional to the amount of area each possesses. Below is the entire TextSurround function:
TextSurround[contents_List] :=
Module[{ dimens, datatable, adjustablewidths, colwidths, colsums,
  params, sizes, col, solutions},
 dimens = Dimensions[contents];
 datatable =
  Table[StringLength[contents[[i, j]]], {i, dimens[[1]]}, {j,
    dimens[[2]]}];
 adjustablewidths = Table[col[i], {i, dimens[[2]] - 1}];
 colwidths =
  Append[adjustablewidths, Subtract[1, Total[adjustablewidths]]];
 colsums = Table[Total[Transpose[datatable][[i]]], {i, dimens[[2]]}];
 solutions  =
  N[Drop[optimalcolwidths, {dimens[[2]]}]/Total[optimalcolwidths]];
 params =
  Sequence @@ ({#, .01, 1/Sqrt[dimens[[2]]],
       ControlPlacement -> Top} & /@
     Table[{adjustablewidths[[i]], solutions[[i]],
       StringJoin["Column " , IntegerName[i], " width"]}, {i,
       dimens[[2]] - 1}]);
 sizes = Scaled /@ colwidths;
 Column[{
   With[{$sizes = sizes, $params = params},
    Manipulate[
     TextGrid[contents, Alignment -> {Center}, ItemSize -> {$sizes},
      Frame -> All], $params
     ]
    ]
   }
  ]
 ]
If the user wants to upload a CSV file rather than a pure list, the following function does that conversion:
convertToList[spreadsheet_String] :=
 DeleteCases[DeleteCases[Import[spreadsheet], "", 2], {}, 2]
TextSqueeze Function
While TextSurround produces a fine approximation of the optimal table, there are instances in which even TextGrid (the default text table display function in the Wolfram Language), does better to reduce a text table's extra space. The fairly general and overly simplistic method employed by TextSurround begs an investigation of the situations in which using the ratios of characters in each column doesn't work well.
I've concluded that these ratios of characters in each column is worst when the standard deviation of each cell from the average number of characters per cell in its column is largest. In other words, when the cells in a column vary greatly in the amount of text they hold, constraining each of those cells to the average width will be very inaccurate. Hence, taking into account the deviation of each cell from the mean for its column could help to refine the precision of TextSurround's methods, while still evading the use of the time-sucking NMinimize function.
The TextSqueeze function does just that. It finds the column width fractions that would be used in TextSurround. Then, for each column, it finds the value of each cell's number of characters divided by its column width fraction. It then takes the average of these quotients for each column, which can be called the average deviations. The original column widths found by the same methods in TextSurround are then multiplied by each of their average deviations in order to better adjust them to their contents. They are then rescaled in order to have a sum of 1, so that each value represents the corresponding fraction of the total table width. This process (admittedly hard to follow) is shown below.
colmeans =
 Table[Total[Transpose[datatable][[i]]], {i, dimens[[2]]}]/
  dimens[[1]]; (*mean number of characters per cell in each column*)
\
deviations =
 Table[Transpose[datatable][[i]]/colmeans[[i]], {i,
   dimens[[2]]}]; (*deviation of number of character's in each cell \
from the average number of characters for that cell's column*)
\
meanDeviations =
 Mean /@ Abs[
   deviations -
    1]; (*mean deviation of cells for each row; without absolute \
value, negative and positive directions of deviation cancel each \
other out*)
solutions =
 Table[(1 + meanDeviations[[i]]) colmeans[[i]], {i, dimens[[2]]}];
Below is the full TextSqueeze function:
TextSqueeze[contents_List /;
    Depth[contents] == 3,
  tablewidth_Real /; 0 <= tablewidth <= 1] :=
 Module[
  { dimens, datatable, colmeans, meanDeviations, solutions, params,
   sizes, col, deviations},
  dimens =
   Dimensions[
    contents]; (*shorthand for the dimensions of the dataset*)
  datatable =
   Table[StringLength[contents[[i, j]]], {i, dimens[[1]]}, {j,
     dimens[[2]]}]; (*recording the number of equal-
  width text characters in each cell*)
  colmeans =
   Table[Total[Transpose[datatable][[i]]], {i, dimens[[2]]}]/
    dimens[[1]]; (*mean number of characters per cell in each column*)
    deviations =
   Table[Transpose[datatable][[i]]/colmeans[[i]], {i,
     dimens[[2]]}]; (*deviation of number of character's in each cell \
from the average number of characters for that cell's column*)
  meanDeviations =
   Mean /@ Abs[
     deviations - 1];
(*mean deviation of cells for each row;
  without absolute value,
  negative and positive directions of deviation cancel each other out*)
    solutions =
   Table[(1 + meanDeviations[[i]]) colmeans[[i]], {i,
     dimens[[2]]}]; (*multiplies the average deviation in a column by \
the width that would be established by TextSurround*)
  TextGrid[contents, Alignment -> {Center},
   ItemSize -> {Scaled /@
      N[tablewidth*Rescale[solutions, {0, Total[solutions]}]]},
   Frame -> All]
  ]
Timing and Accuracy Comparisons of TextConstrict, TextSurround, and TextSqueeze
In order to find precisely how well and fast these functions operate for data of different sizes, I generated some sample data repeatedly and averaged the results. Below are two graphs; the first plots the amount of time each function takes to run against the number of rows of a square dataset and the second displays the area to which each function minimizes the given table. 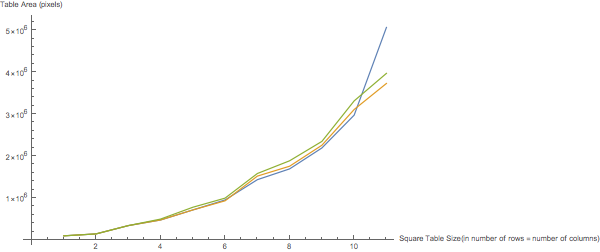
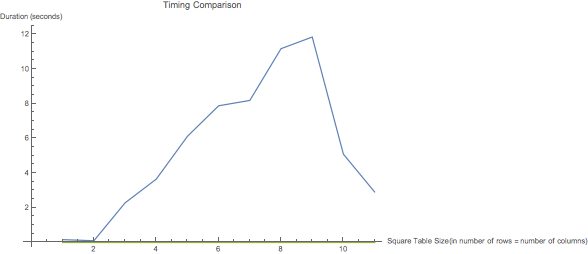
As can be seen in above graph, an anomalous drop occurs in the TextConstrict function line after the number of rows in the sample table exceeds ten, which is likely a product of some sort of reduction in accuracy automated by NMinimize function that allows reduction in timing. This conclusion is consistent with the Accuracy plot, where the TextConstrict function's relative minimizing ability is reduced tremendously around the same table size.
Numerically, TextSqueeze and TextSurround produce table only a few percent larger in terms of area than TextConstrict. In the code below, accuracies[[1]] are the table areas produced by TextConstrict, accuracies[[2]] are those produced by TextSqueeze, and accuracies[[3]] are those produced by TextSurround
(*Before weird deviation happens for TextConstrict (occurs circa \
number of rows in table is 11*)

Mean[accuracies[[2]][[1 ;; 10]]/accuracies[[1]][[1 ;; 10]] - 1] // N
Mean[accuracies[[3]][[1 ;; 10]]/accuracies[[1]][[1 ;; 10]] - 1] // N

0.014799

0.0583483
Current Limitations
Although idealizing the problem with continuous blurbs rather than groups of discrete characters is helpful for the optimization in TextConstrict, it sometimes results in the table not being the perfect solution. For instance, the column widths that would optimize a table with continuously adjustable blurbs, may cause an extra line break due to word length irregularities.
In addition, as alluded to in "Timing and Accuracy Comparisons," TextConstrict becomes much less accurate when the table's dimensions exceed 10 by 10.
Lastly, each of the above functions share many of the same components. While actual functions imbedded in the Wolfram Language have Options, there doesn't seem to be any such functionality for user-designed functions. Hence, whenever there was a slight variation in method, the creation of a completely new function was necessary. If there is ever a point when these algorithms are ingrained into the Wolfram Language, it would likely be best for them to be a single function, with various Option settings to determine which specific method is to be used.
Looking Forward
I think there is an interesting theoretical implication of my process of finding approximation algorithms. First, in TextSurround (the most basic, first-order approximation method), the ratio of the column widths is set equal to the ratio of the number of characters in each. Then, in TextSqueeze (what could be called a second-order approximation method), each of these column width ratios is multiplied by the column's average deviation, which produces a refined approximation. In theory, this process could be extended to produce better and better accuracy. The next step would likely also take into account the column widths' deviations from the average deviations themselves.
In this way, a Taylor-polynomial-like approximation can be made for the optimal data table. You may ask, why do this when we have already developed a working function that finds the exact optimal dimensions (TextConstrict)? There are two reasons. The first is that the revised algorithm would probably take less time. Second: the process of extending a simple method of approximation ad infinitum is quite beautiful.
Thanks for reading!
 Attachments:


