Data Collection
Murder by firearms
The FBI, through its criminal justice information services division, collects information on murders by types of weapon, at a state level. Statistics available are from 2011.
https://www.fbi.gov/about-us/cjis/ucr/crime-in-the-u.s/2011/crime-in-the-u.s.-2011/tables/table-20
murderData =
 Import["https://www.fbi.gov/about-us/cjis/ucr/crime-in-the-u.s/2011/\
crime-in-the-u.s.-2011/tables/table-20", "Data"][[3, 2, 3,
  2]]; murderLbl = First@murderData; murderData =
 Most@First@Rest@murderData;
murderData[[All, 1]] =
  Check[Interpreter["AdministrativeDivision"][#], #] & /@
   murderData[[All, 1]];
murderData[[12, 1]] = Entity["AdministrativeDivision", {"Illinois", "UnitedStates"}]
MapIndexed[Sequence, murderLbl]
   (*{"State", {1}, "Total murders 1", {2}, "Total firearms", {3}, "Handguns", {4}, "Rifles", {5}, "Shotguns", {6}, "Firearms (type unknown)", {7}, "Knives or cutting instruments", {8}, "Other \
weapons", {9}, "Hands, fists, feet, etc. 2", {10}}*)
Population Data
Population data is readily available in Wolfram Mathematica.
pop = EntityValue[murderData[[All, 1]], "Population"];
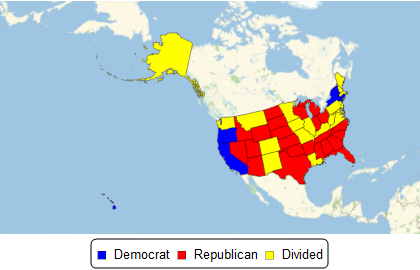
Legislative Control
State and legislative control data can be obtained from the National Conference of State Legislatures.
http://www.ncsl.org/Portals/1/Documents/Elections/LegisControl 2016_Apr20.pdf
Data was scrubbed and placed in variable stateComposition that holds the information on which party holds the power for the state. Finally a dataset was created holding the political control of each state.
dComp = Dataset[
  Association[(Thread[
     Rule[stateComposition[[All,
       1]], (AssociationThread[{"abbreviation", "party"}, #] & /@
        stateComposition[[All, 2 ;; 3]])]])]]

GeoRegionValuePlot[(dComp[All, "party"] // Normal //
    Normal) /. {"Dem" -> 1, "Rep" -> 2, "Divided" -> 3},
 ColorRules -> {1 -> Blue, 2 -> Red, 3 -> Yellow},
 PlotLegends ->
  Placed[SwatchLegend[{Blue, Red, Yellow}, {"Democrat", "Republican",
     "Divided"}, LegendFunction -> "Frame"], Bottom]]
Gun Freedom Index
Used Guns & Ammo Magazine data to rank states numerically based on the following categories.
- Right to Carry: how restrictive each state are in prohibiting carry in different locations, how readily can citizens obtain permits, etc.
- Modern Sporting Rifles: restrictions on semiautomatic firearms not regulated by NFA and restrictions on magazine capacity and/or accessories.
- NFA: The National Firearms Act (NFA) of 1934 has placed certain restrictions on the purchase of certain categories of weaponry. States can further restrict and regulate these weapons (machine guns, silencers, short-barrelled rifles and shotguns, etc..
- Castle Doctrine: English common law established that a man's home is his castle and has a right to defend it. Status and case law in each state can regulate and impose restrictions in a citizen's ability for self defense.
- Miscellaneous: issues such as purchase/registrations requirements, gun ownership percentage, availability of ranges, etc.
http://www.gunsandammo.com/network-topics/culture-politics-network/best-states-for-gun-owners-2014/
SetDirectory[NotebookDirectory[]];
gunFreedomIndexData = SemanticImport["gunfreedomindex.xlsx"];
gfi[state_] :=
 Flatten@Normal[
   Normal[gunFreedomIndexData[
      Select[#State == state &], {"Ranking", "total"}][Values]]]
gfi = gfi[#] & /@ murderData[[All, 1]];
(*data={#\[LeftDoubleBracket]1\[RightDoubleBracket],100000#\
\[LeftDoubleBracket]2\[RightDoubleBracket]/QuantityMagnitude[#\
\[LeftDoubleBracket]3\[RightDoubleBracket]]//N,#\[LeftDoubleBracket]4\
\[RightDoubleBracket],#\[LeftDoubleBracket]5\[RightDoubleBracket]}&/@(\
Flatten[#]&/@Transpose[{murderData[[All,{1,3}]],pop,gfi}])*)
ds = Dataset[Association[(Thread[Rule[data[[All, 1]], (AssociationThread[{"gunFreedomIndex",
       "murderByFirearm"}, #] & /@ data[[All, {3, 2}]])]])]]
Auxiliary functions for Data Visualization
colorRules = {"Dem" -> (BaseStyle -> {FontColor -> White,
       Background -> Blue}),
   "Divided" -> (BaseStyle -> {FontColor -> Black,
       Background -> Yellow}),
   "Rep" -> (BaseStyle -> {FontColor -> White, Background -> Red})};
text[state_, function_] :=
 Text[dComp[state, "abbreviation"], function[state],
  dComp[state, "party"] /. colorRules]
Data Visualization
Murder Rates by Firearms vs. Gun Control
Let's chart the murder rates vs. the gun freedom ranking. This should give us an indication if the gun control restrictions have any influence on murder rates committed with firearms.
coords[state_] :=
 ds[state][{"gunFreedomIndex", "murderByFirearm"}] // Values // Normal
lmf = LinearModelFit[coords /@ Normal[Keys[ds]], x, x];
Column[{Show[
   ListPlot[coords /@ Normal[Keys[ds]], PlotTheme -> "Detailed",
    FrameLabel -> {"Gun Freemdom Ranking",
      "MurderByFireArmRate (per 100k)"},
    Epilog ->
     Inset[Style[
       "\!\(\*SuperscriptBox[\(R\), \(2\)]\)=" <>
        ToString@lmf["AdjustedRSquared"]], {5, 11}],
    PlotRangePadding -> None, PlotRange -> {{0, 52}, {0, 12}},
    ImageSize -> Large,
    PlotLabel ->
     Style["Murder Rate vs Gun Control Measures", Black, Bold]],
   Plot[lmf[x], {x, 0, 52}],
   Graphics[text[#, coords] & /@ Normal[Keys[ds]]]],
  Row[{Text["Democrat",
     BaseStyle -> {FontColor -> White, Background -> Blue}],
    Text["    "],
    Text["Divided", BaseStyle -> {Background -> Yellow}],
    Text["    "],
    Text["Republican",
     BaseStyle -> {FontColor -> White, Background -> Red}]}]},
 Alignment -> Center]
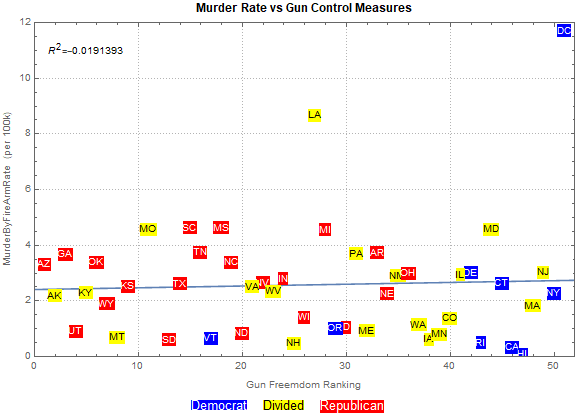
There seems to be no correlation between murders by firearms and the gun freedom index.
Murder Rates by Firearms vs. Gun Ownership Rates
The article by Bindu Kalesan, et al "Gun Ownership and social culture" provide some data points on the gun ownership rates by state.
gunOwnerShip = Import["GunOwnershipRate.xlsx", {"Data", 1}];
gunOwnerShip[[All, 1]] =
 Interpreter["AdministrativeDivision"][#] & /@ gunOwnerShip[[All, 1]];
go = Dataset[Association[Rule[#1, #2] & @@@ gunOwnerShip]]
gof[state_] := {go[state], ds[state]["murderByFirearm"]}
lmf = LinearModelFit[gof /@ Normal[Keys[ds]], x, x];
Column[{Show[
   ListPlot[gof /@ Normal[Keys[ds]], PlotTheme -> "Detailed",
    FrameLabel -> {"Gun Ownership (%)",
      "MurderByFireArmRate (per 100k)"},
    Epilog ->
     Inset[Style[
       "\!\(\*SuperscriptBox[\(R\), \(2\)]\)=" <>
        ToString@lmf["AdjustedRSquared"]], {60, 11}],
    PlotRangePadding -> None, ImageSize -> Large,
    PlotRange -> {{0, 70}, {0, 12}},
    PlotLabel ->
     Style["Murder Rate vs Gun Ownership (%)", Black, Bold]],
   Plot[lmf[x], {x, 0, 70}],
   Graphics[text[#, gof] & /@ Normal[Keys[ds]]]],
  Row[{Text["Democrat",
     BaseStyle -> {FontColor -> White, Background -> Blue}],
    Text["    "],
    Text["Divided", BaseStyle -> {Background -> Yellow}],
    Text["    "],
    Text["Republican",
     BaseStyle -> {FontColor -> White, Background -> Red}]}]},
 Alignment -> Center]
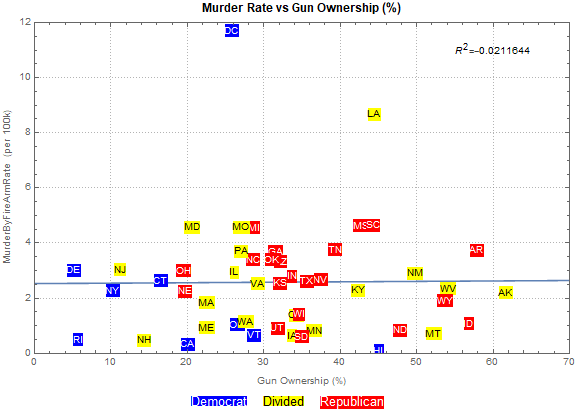
In this case, again, we don't see a correlation between citizen gun ownership and murder rates. We can't say the same regarding the availability of guns to law abiding citizens.
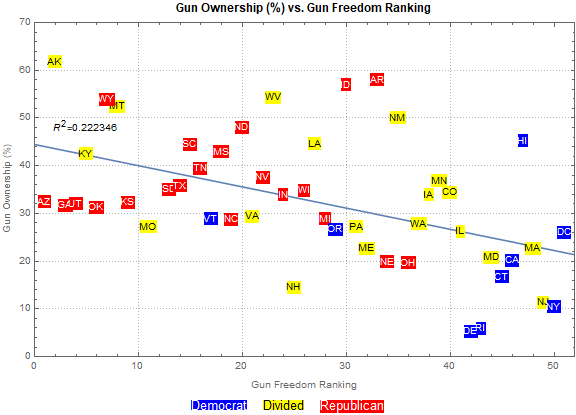
gRestriction[state_] := {ds[state]["gunFreedomIndex"], go[state]};
lmf = LinearModelFit[gRestriction /@ Normal[Keys[ds]], x,
  x]; Column[{Show[
   ListPlot[gRestriction /@ Normal[Keys[ds]], PlotTheme -> "Detailed",
     FrameLabel -> {"Gun Freedom Ranking", "Gun Ownership (%)"},
    Epilog ->
     Inset[Style[
       "\!\(\*SuperscriptBox[\(R\), \(2\)]\)=" <>
        ToString@lmf["AdjustedRSquared"]], {5, 48}],
    PlotRangePadding -> None, ImageSize -> Large,
    PlotRange -> {{0, 52}, {0, 70}},
    PlotLabel ->
     Style["Gun Ownership (%) vs. Gun Freedom Ranking", Black, Bold]],
    Plot[lmf[x], {x, 0, 52}],
   Graphics[text[#, gRestriction] & /@ Normal[Keys[ds]]]],
  Row[{Text["Democrat",
     BaseStyle -> {FontColor -> White, Background -> Blue}],
    Text["    "],
    Text["Divided", BaseStyle -> {Background -> Yellow}],
    Text["    "],
    Text["Republican",
     BaseStyle -> {FontColor -> White, Background -> Red}]}]},
 Alignment -> Center]
Let's explore the data against socioeconomic factors now.
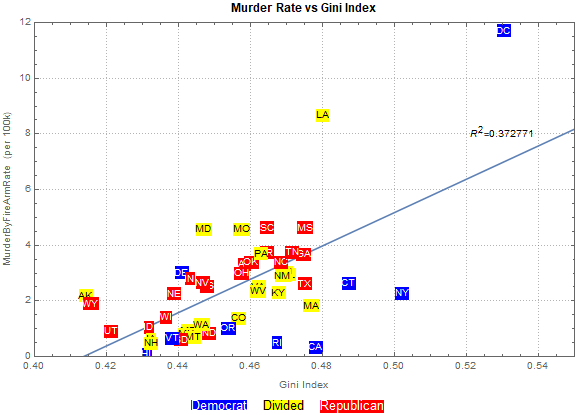
Murder Rates vs Income Inequality
The Gini Index is a measure of income inequality:
gini[state_] := {EntityValue[state, "GiniIndex"],
  ds[state]["murderByFirearm"]}
lmf = LinearModelFit[gini /@ Normal[Keys[ds]], x, x]
Column[{Show[
   ListPlot[gini /@ Normal[Keys[ds]], PlotTheme -> "Detailed",
    FrameLabel -> {"Gini Index", "MurderByFireArmRate (per 100k)"},
    Epilog ->
     Inset[Style[
       "\!\(\*SuperscriptBox[\(R\), \(2\)]\)=" <>
        ToString@lmf["AdjustedRSquared"]], {0.53, 8}],
    PlotRangePadding -> None, ImageSize -> Large,
    PlotRange -> {{0.4, 0.55}, {0, 12}},
    PlotLabel -> Style["Murder Rate vs Gini Index", Black, Bold]],
   Plot[lmf[x], {x, 0.4, 0.55}],
   Graphics[text[#, gini] & /@ Normal[Keys[ds]]]],
  Row[{Text["Democrat",
     BaseStyle -> {FontColor -> White, Background -> Blue}],
    Text["    "],
    Text["Divided", BaseStyle -> {Background -> Yellow}],
    Text["    "],
    Text["Republican",
     BaseStyle -> {FontColor -> White, Background -> Red}]}]},
 Alignment -> Center]
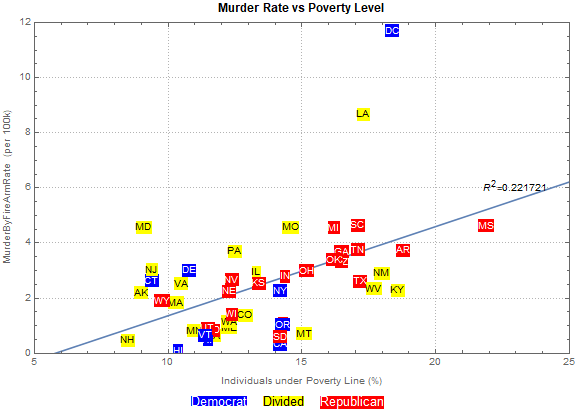
Murder Rate vs. Poverty Level
Poverty level data was obtained from the Census Bureau. Numbers represent estimated number of individuals in 2009 living below the poverty level. (http://www2.census.gov/library/publications/2011/compendia/statab/131ed/tables/12s0709.xls)
    stateRules =
     Thread[Rule[
       EntityValue[
        EntityList[
         EntityClass["AdministrativeDivision", "AllUSStatesPlusDC"]],
        "StateAbbreviation"],
       EntityList[
        EntityClass["AdministrativeDivision", "AllUSStatesPlusDC"]]]]

    povertyLevel =
     Dataset[Association[
       Rule[#1, #2] & @@@ {{"AL", 17.5}, {"AK", 9.}, {"AZ", 16.5}, {"AR",
           18.8}, {"CA", 14.2}, {"CO", 12.9}, {"CT", 9.4}, {"DE",
           10.8}, {"DC", 18.4}, {"FL", 14.9}, {"GA", 16.5}, {"HI",
           10.4}, {"ID", 14.3}, {"IL", 13.3}, {"IN", 14.4}, {"IA",
           11.8}, {"KS", 13.4}, {"KY", 18.6}, {"LA", 17.3}, {"ME",
           12.3}, {"MD", 9.1}, {"MA", 10.3}, {"MI", 16.2}, {"MN",
           11.}, {"MS", 21.9}, {"MO", 14.6}, {"MT", 15.1}, {"NE",
           12.3}, {"NV", 12.4}, {"NH", 8.5}, {"NJ", 9.4}, {"NM",
           18.}, {"NY", 14.2}, {"NC", 16.3}, {"ND", 11.7}, {"OH",
           15.2}, {"OK", 16.2}, {"OR", 14.3}, {"PA", 12.5}, {"RI",
           11.5}, {"SC", 17.1}, {"SD", 14.2}, {"TN", 17.1}, {"TX",
           17.2}, {"UT", 11.5}, {"VT", 11.4}, {"VA", 10.5}, {"WA",
           12.3}, {"WV", 17.7}, {"WI", 12.4}, {"WY", 9.8}} /. stateRules]]
poverty[state_] := {povertyLevel[state], ds[state]["murderByFirearm"]}
lmf = LinearModelFit[poverty /@ Normal[Keys[ds]], x, x]
Column[{Show[
   ListPlot[poverty /@ Normal[Keys[ds]], PlotTheme -> "Detailed",
    FrameLabel -> {"Individuals under Poverty Line (%)",
      "MurderByFireArmRate (per 100k)"},
    Epilog ->
     Inset[Style[
       "\!\(\*SuperscriptBox[\(R\), \(2\)]\)=" <>
        ToString@lmf["AdjustedRSquared"]], {23, 6}],
    PlotRangePadding -> None, ImageSize -> Large,
    PlotRange -> {{5, 25}, {0, 12}},
    PlotLabel -> Style["Murder Rate vs Poverty Level", Black, Bold]],
   Plot[lmf[x], {x, 5, 25}],
   Graphics[text[#, poverty] & /@ Normal[Keys[ds]]]],
  Row[{Text["Democrat",
     BaseStyle -> {FontColor -> White, Background -> Blue}],
    Text["    "],
    Text["Divided", BaseStyle -> {Background -> Yellow}],
    Text["    "],
    Text["Republican",
     BaseStyle -> {FontColor -> White, Background -> Red}]}]},
 Alignment -> Center]
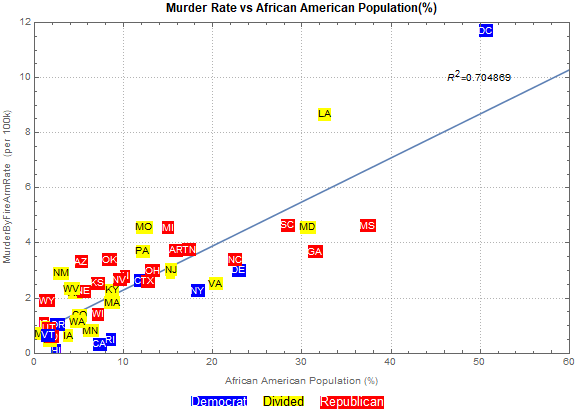
Murder Rates vs Race Composition
Population estimates by race were obtained from the US Census Bureau. (https://www.census.gov/popest/data/state/asrh/2014/index.html)
  race = Import["PEP_2011_PEPSR5H.xls", {"Data", 1}];
  racelbl = Rest@First@race; race = Rest@Rest@race;
  race[[All, 1]] =
    Interpreter["AdministrativeDivision"][#] & /@ race[[All, 1]];
  dsRace = Dataset[
    Association[
     Thread[Rule[race[[All, 1]],
       AssociationThread[racelbl, #] & /@ race[[All, 2 ;;]]]]]]
aaRate[state_] := {100 dsRace[state, "africanamericanRate"],
  ds[state, "murderByFirearm"]}
lmf = LinearModelFit[aaRate /@ Normal[Keys[ds]], x, x]
Column[{Show[
   ListPlot[aaRate /@ Normal[Keys[ds]], PlotTheme -> "Detailed",
    FrameLabel -> {"African American Population (%)",
      "MurderByFireArmRate (per 100k)"}, PlotRangePadding -> None,
    ImageSize -> Large, PlotRange -> {{0, 60}, {0, 12}},
    Epilog ->
     Inset[Style[
       "\!\(\*SuperscriptBox[\(R\), \(2\)]\)=" <>
        ToString@lmf["AdjustedRSquared"]], {50, 10}],
    PlotLabel ->
     Style["Murder Rate vs African American Population(%)", Black,
      Bold]], Plot[lmf[x], {x, 0, 60}],
   Graphics[text[#, aaRate] & /@ Normal[Keys[ds]]]],
  Row[{Text["Democrat",
     BaseStyle -> {FontColor -> White, Background -> Blue}],
    Text["    "],
    Text["Divided", BaseStyle -> {Background -> Yellow}],
    Text["    "],
    Text["Republican",
     BaseStyle -> {FontColor -> White, Background -> Red}]}]},
 Alignment -> Center]
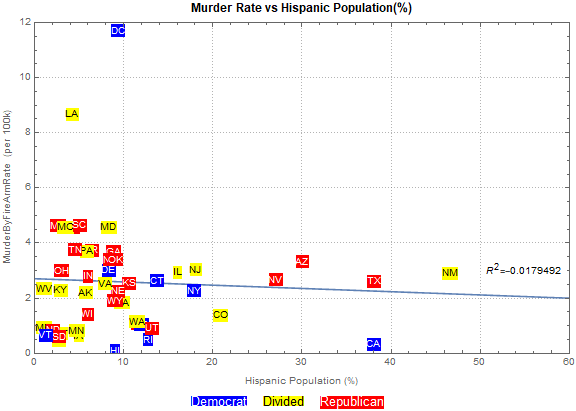
The Pew Hispanic center monitors the trends of hispanic population in the US. Breakout of the population population by states is availabe t their website. http://www.pewhispanic.org/states/
hispanicData =
  Import["http://www.pewhispanic.org/files/states/xls/ALL_11.xlsx", \
{"Data", 1}];
hispanicDataLbl = hispanicData[[5]];
hispanicData = hispanicData[[7 ;;]];
hispanicData[[All, 1]] =
  Interpreter ["AdministrativeDivision"][#] & /@
   hispanicData[[All, 1]];
dsHispanic =
 Dataset[Association[
   Thread[Rule[hispanicData[[All, 1]], hispanicData[[All, 3]]]]]];
hispanic[state_] := {100 dsHispanic[state],
  ds[state, "murderByFirearm"]}
lmf = LinearModelFit[hispanic /@ Normal[Keys[ds]], x, x]

Column[{Show[
   ListPlot[hispanic /@ Normal[Keys[ds]], PlotTheme -> "Detailed",
    FrameLabel -> {"Hispanic Population (%)",
      "MurderByFireArmRate (per 100k)"}, PlotRangePadding -> None,
    ImageSize -> Large, PlotRange -> {{0, 60}, {0, 12}},
    Epilog ->
     Inset[Style[
       "\!\(\*SuperscriptBox[\(R\), \(2\)]\)=" <>
        ToString@lmf["AdjustedRSquared"]], {55, 3}],
    PlotLabel ->
     Style["Murder Rate vs Hispanic Population(%)", Black, Bold]],
   Plot[lmf[x], {x, 0, 60}],
   Graphics[text[#, hispanic] & /@ Normal[Keys[ds]]]],
  Row[{Text["Democrat",
     BaseStyle -> {FontColor -> White, Background -> Blue}],
    Text["    "],
    Text["Divided", BaseStyle -> {Background -> Yellow}],
    Text["    "],
    Text["Republican",
     BaseStyle -> {FontColor -> White, Background -> Red}]}]},
 Alignment -> Center]