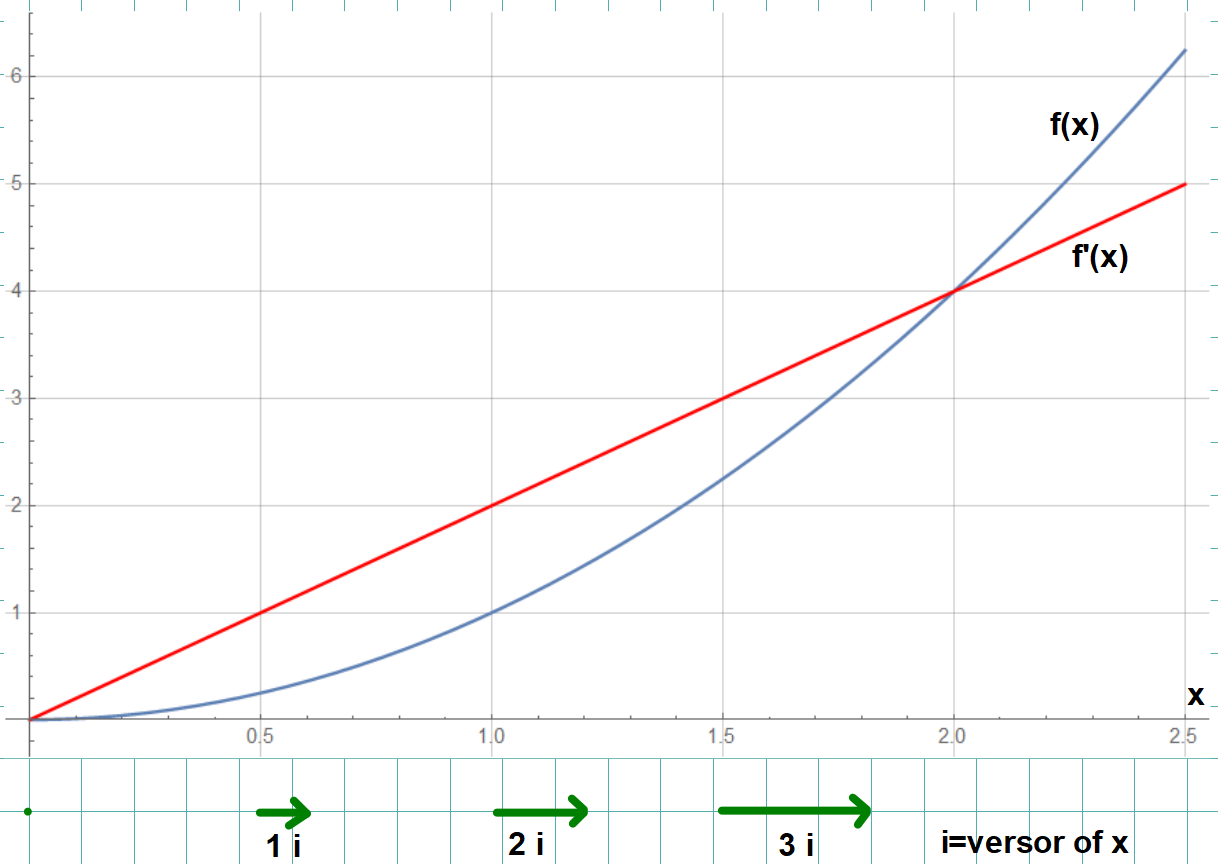
Hello everyone, I'd like to plot the gradient of a function of a variable. Before I hope that the derivative is the component of the gradient, that is a scalar, instead the gradient is a vector. For example, for the function f(x)=x^2 and f'(x)=2x, the gradient should be the plot with green arrows:

I tried to do it with the following statement:
VectorPlot[{2 x, 0}, {x, -3, 3}, {y, 0, 0.00001}]
Is it correct?
When I try to plot f(x), f'(x) and gradient, I get a strange plot because maybe the range {y, 0, 0.00001} in VectorPlot does not allow to show me the range I set:
Show[VectorPlot[{2 x, 0}, {x, 0, 2.5}, {y, 0, 0.00001}],
 Plot[x^2, {x, 0, 2.5}, PlotRange -> {{0, 2.5}, {0, 6}}],
 Plot[2 x, {x, 0, 2.5}, PlotRange -> {{0, 2.5}, {0, 6}},
  PlotStyle -> Red]]
Thank you so much for your time.