Hi
Wolfram Alfa uses a standard options to display ContourPlots. Maybe it's related to performance and display time
In Mathematica we have to controls on all options.
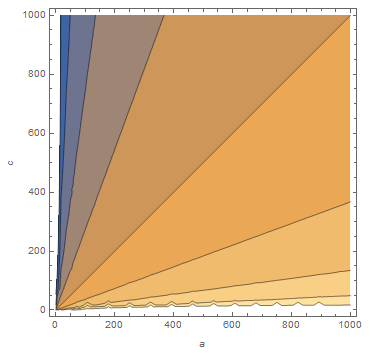
ContourPlot[Log[(a + 1)/(c + 1)], {a, 0, 1000}, {c, 0, 1000},
FrameLabel -> Automatic](*Automatic option like WolframAlfa*)
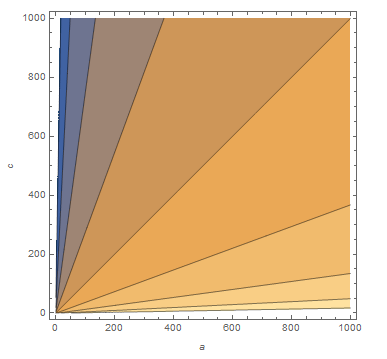
PlotPoint option is to get smoother contours.
ContourPlot[Log[(a + 1)/(c + 1)], {a, 0, 1000}, {c, 0, 1000},
FrameLabel -> Automatic, PlotPoints -> 100](*And here we need more CPU time*)
Regards,
Mariusz.


