CLICK on the image to zoom. Use your browser's back button to return to reading the post.

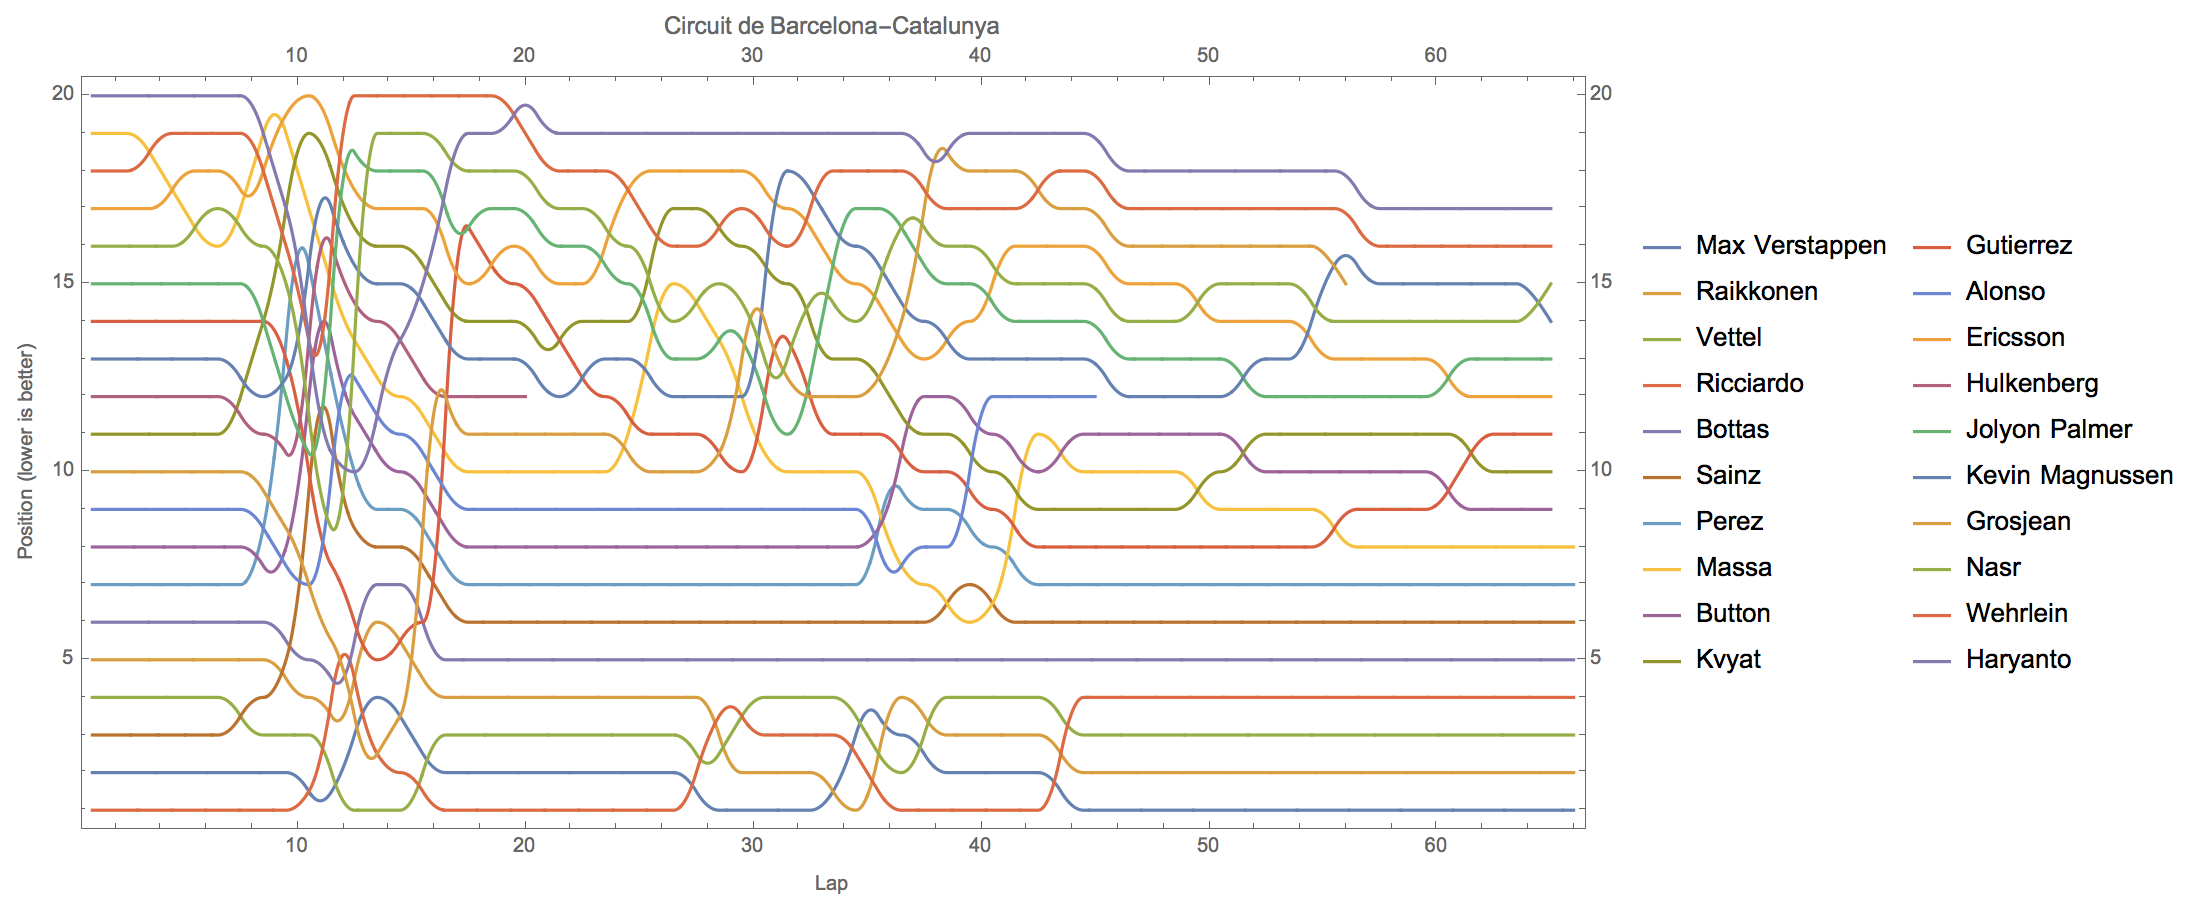
After watching F1 I was curious how the positions change over time.
So first we get the data from the internet (takes some time):
data = Import["http://ergast.com/api/f1/2016/5/laps.json?limit=2500"];
Let's extract some data from it:
trackname = FirstCase[data, ("circuitName" -> x_) :> x, Missing[], \[Infinity]]
sel = FirstCase[data, ("Laps" -> x_) :> x, Missing[], \[Infinity]];
giving:
Circuit de Barcelona-Catalunya
Let's make a small functions that transforms the data:
ClearAll[LapToGrid]
LapToGrid[data_] := Module[{num, tim},
      num = "number" /. data;
      tim = "Timings" /. data;
      tim = {"driverId", "position", "time", num} /. tim;
      tim
  ]
Let's now get the data and plot it using ListLinePlot:
tmp=Join@@(LapToGrid/@sel);
tmp2=KeyValueMap[List,GroupBy[tmp,First->(#[[{4,2}]]&)]];
tmp2=SortBy[tmp2,ToExpression[#[[-1,-1,-1]]]&];
plotdata=Map[ToExpression,tmp2[[All,2]],{3}];
names=StringRiffle[Capitalize[StringSplit[#,"_"]]]&/@tmp2[[All,1]];
ListLinePlot[plotdata,
    PlotRange->{{1,All},{1,All}},
    PlotRangePadding->0.5,
    AspectRatio->1/2,
    PlotLegends->names,
    ImageSize->800,
    Frame->True,
    FrameTicks->All,
    FrameLabel->{"Lap","Position (lower is better)"},
    PlotLabel->trackname
]/.Line[x_]:>BSplineCurve[x,SplineDegree->2]

Now every time one overtakes another (or got overtaken) you will see two lines swap. Hope you enjoyed this short post!