Seems that Excels's graphics is somewhat misleading.
With
y[x_] := 0.0008 x^6 + 0.0013 x^5 - 0.1054 x^4 + 0.6517 x^3 -1.493 x^2 + 0.9054 x + 0.8343
Try
Plot[y[x], {x, 3, 4}]
and you see that short above 3.4 negative values occur.
Perhaps you should try another model? (data are the x, y pairs in your Excel-sheet)
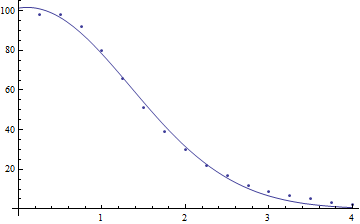
nlm = NonlinearModelFit[data, a Exp[-b (x - c)^2], {a, b, c}, x] // Normal
This gives
y = 101.708 E^(-0.326251 (-0.102446 + x)^2)
and this will never have negative values.
 Attachments:


