I was inspired by Wolfram's chart of statistical distribution functions and wanted to know what other sets functions where out there and how long they have been around. With the WolframLanguageData function and the "FunctionalityAreas" property I was able to get a list of all the official areas.
functionAreas =
 AlphabeticSort@
  DeleteDuplicates@
   Flatten@EntityValue[WolframLanguageData[], "FunctionalityAreas"];

Length@functionAreas

> 181

functionAreas // Short

> {AlgebraicSymbols,AlignmentSymbols,AngleSymbols,AnnotationSymbols,ArraySymbols,<<172>>,VectorTeeOperatorSymbols,ViewerSymbols,WaveletSymbols,WolframAlphaSymbols}
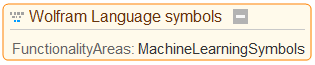
Picking a functionality area.
functionality = "MachineLearningSymbols";
functionalityClass =
 EntityClass[
  "WolframLanguageSymbol", {"FunctionalityAreas" -> functionality}]
len = functionalityClass["EntityCount"]

> 48
To place the symbols on a circular chart the labels will need to be rotated. To rotate in quadrants the number of symbols are subdivided.
quads = Round@Subdivide[len, 4]

> {0, 12, 24, 36, 48}
A rotation helper function is used that takes the index of the symbol and returns the angle it should be rotated by.
angle[n_] :=
 Piecewise[{
   {(-(Pi/2))*((n - 1)/quads[[2]]),
     n <= quads[[2]]},
   {Pi/2 - (Pi/2)*((n - quads[[2]])/(quads[[3]] - quads[[2]])),
     n <= quads[[3]]},
   {2*Pi - (Pi/2)*((n - quads[[3]])/(quads[[4]] - quads[[3]])),
     n <= quads[[4]]},
   {Pi/2 - (Pi/2)*((n - quads[[4]])/(quads[[5]] - quads[[4]])),
    n <= quads[[5]]}
 }]
The symbols and the version they were introduced can be collected from the entity class.
verIntro =
  KeySort@GroupBy[Last -> First]@
    functionalityClass[{"Name", "VersionIntroduced"}];
verIntro // Short

> <|10->{AmbiguityFunction,AmbiguityList,ClassifierFunction,ClassifierInformation,<<6>>,PredictorInformation,PredictorMeasurements,UtilityFunction,ValidationSet},<<4>>|>
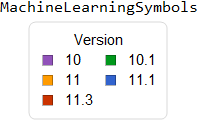
Create a version introduced legend for the chart.
ledgend =
 Labeled[
  SwatchLegend[
   ColorData[{"Indexed", "VibrantColor"}] /@ Range[Length@verIntro],
   Reverse@Keys@verIntro,
   LegendLabel -> "Version",
   LegendLayout -> (Grid[Join @@@ Partition[Reverse@#, UpTo@2],
       Alignment -> Decimal] &),
   LabelStyle -> {FontColor -> Automatic, FontSize -> Medium}],
  Style[functionality, Black],
  Top,
  Frame -> True,
  FrameStyle -> LightGray,
  RoundingRadius -> 5
  ]
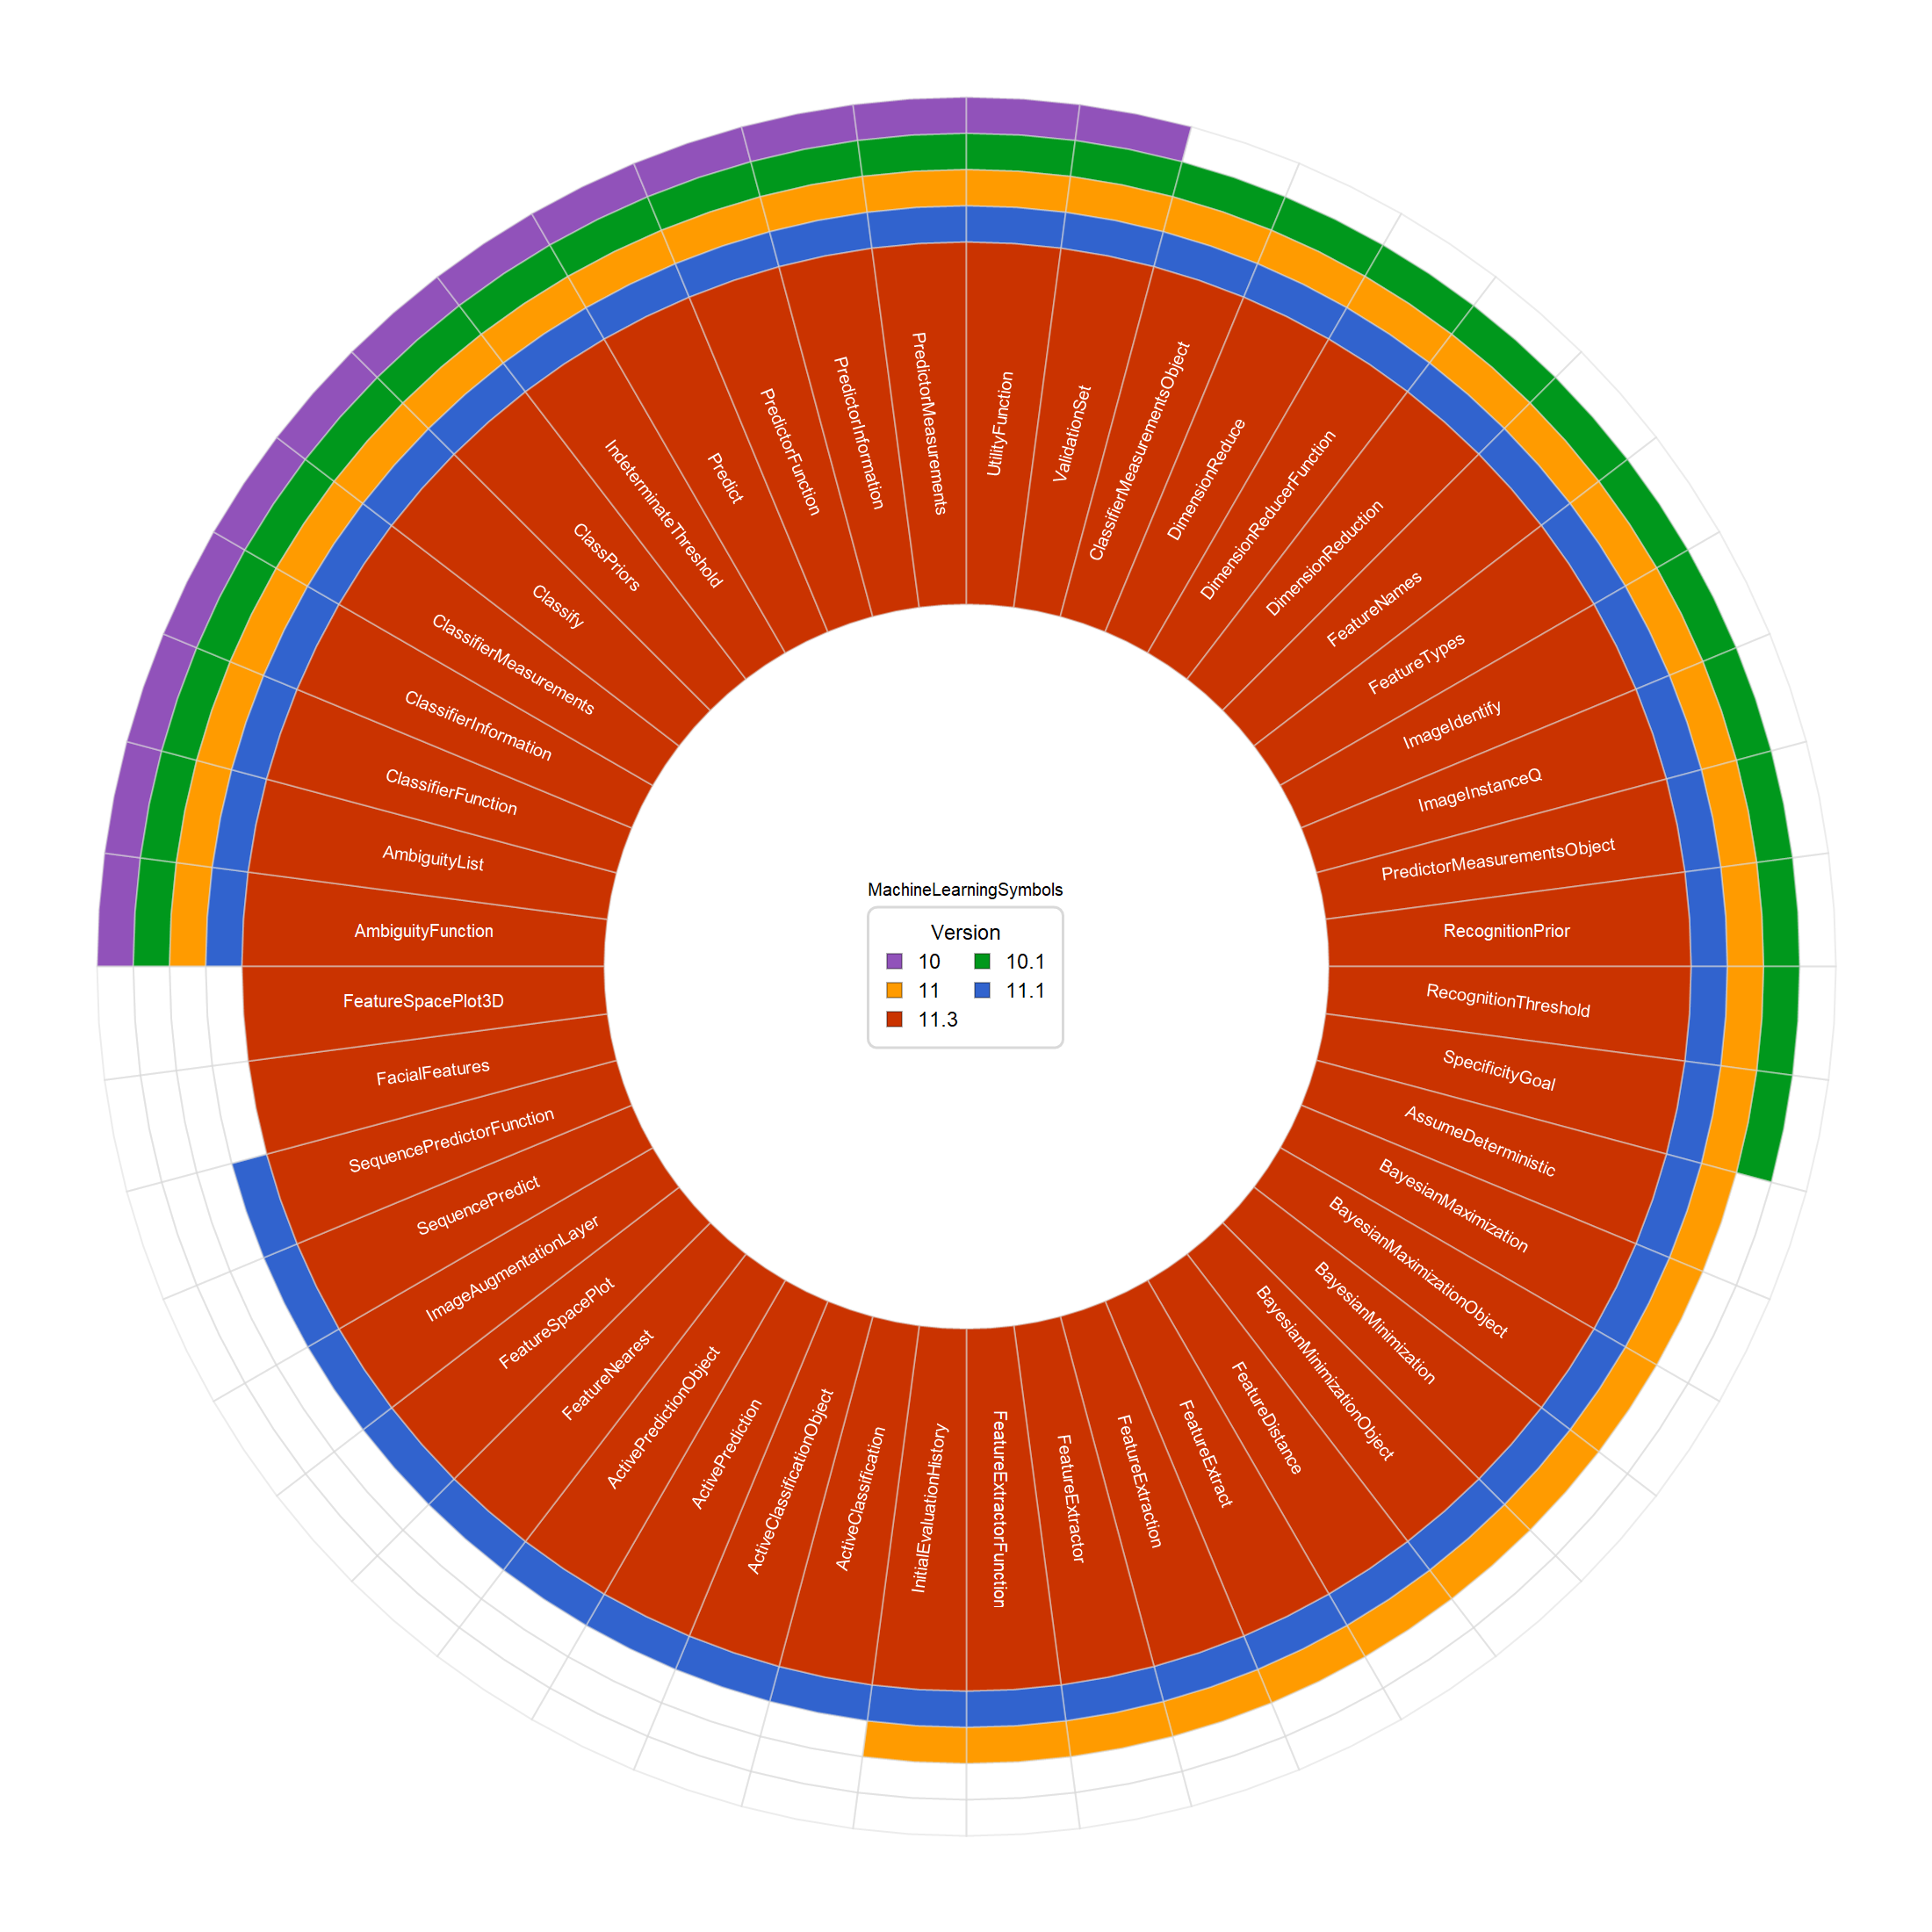
Then plot with SectorChart with the latest version as the inner most ring.
SectorChart[
 {
  MapIndexed[
   Labeled[{1, 1}, Rotate[#, angle[First@#2], {1/2, 1/2}]] &,
   Join @@ Values@verIntro],
  Sequence @@ (Join @@ {ConstantArray[{1, .1}, #1],
        ConstantArray[Style[{1, .1}, Transparent], len - #1]} & /@
     Rest@Reverse@Accumulate@Values[Length /@ verIntro])
  },
 PerformanceGoal -> "Speed",
 SectorOrigin -> {Automatic, 1},
 SectorSpacing -> 0,
 ChartStyle -> {ColorData[{"Indexed", "VibrantColor"}] /@
    Range[Length@verIntro], None},
 ChartBaseStyle -> {EdgeForm[LightGray]},
 Epilog -> {
   Inset[
    ledgend,
    {0, 0}
    ]},
 BaseStyle -> {FontColor -> White},
 ImageSize -> 1100]
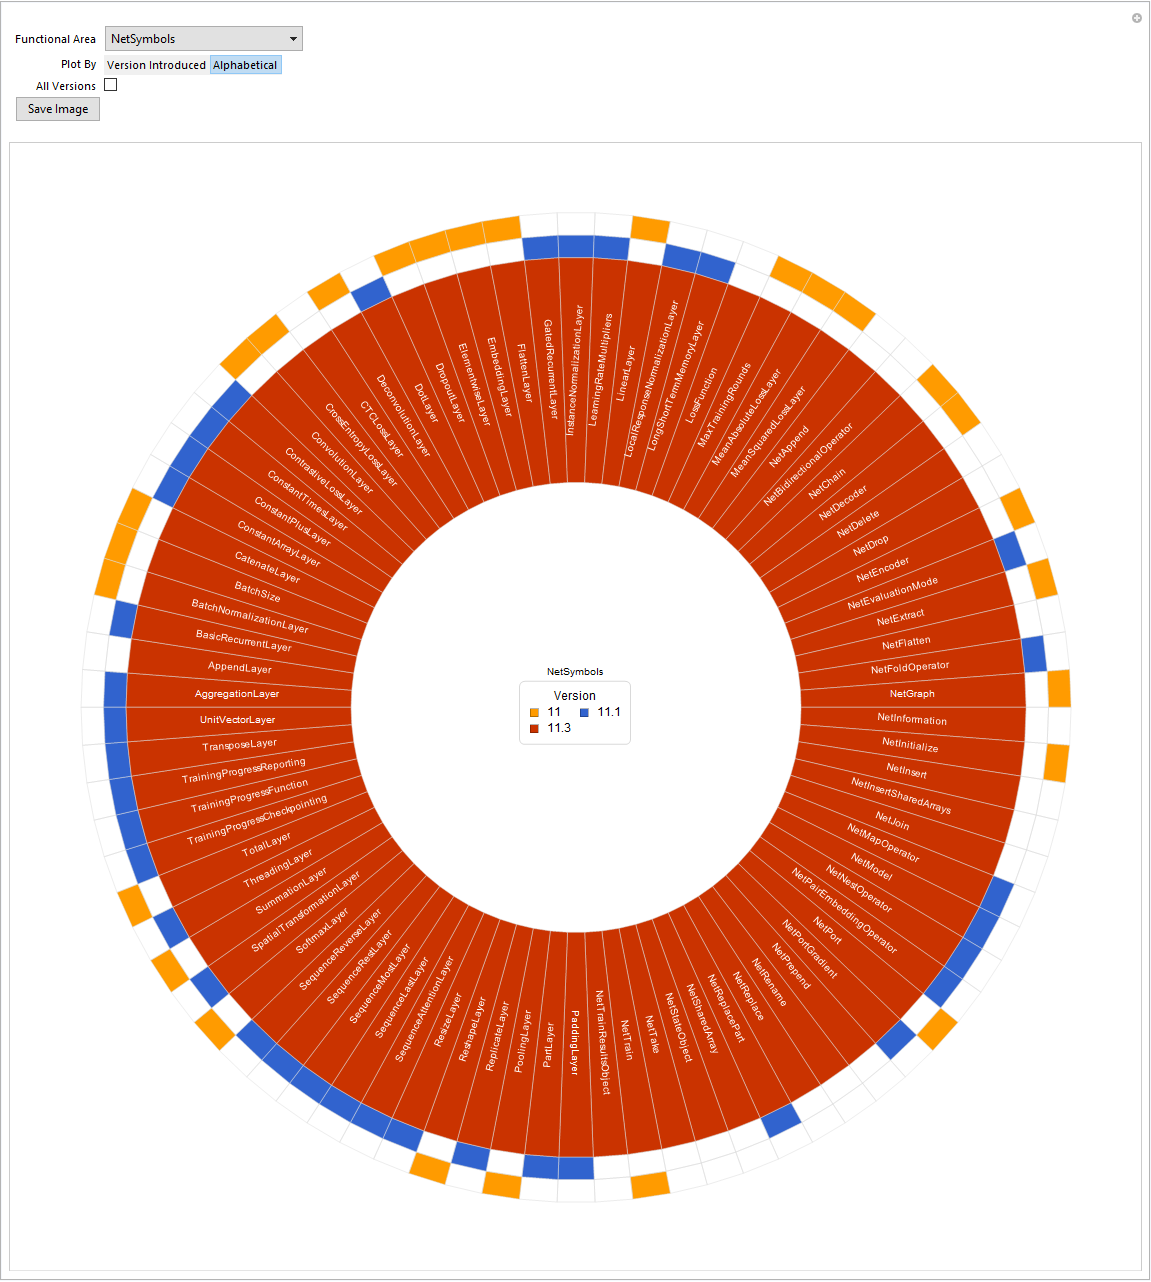
All of the above code can be rolled up into a Manipulate with a few additional features.
- Save the image.
- Toggle the ordering of the chart.
- Toggle showing all versions a symbol is in or only the version it was introduced.
e -
DynamicModule[{functionalityClass, len, quads, angle, verIntro, ledgend, chart, busy},
 Manipulate[

  busy = True;

  functionalityClass =
   EntityClass[ "WolframLanguageSymbol", {"FunctionalityAreas" -> functionality}];
  len = functionalityClass["EntityCount"];
  quads = Round@Subdivide[len, 4];
  verIntro =
   KeySort@GroupBy[Last -> First]@functionalityClass[{"Name", "VersionIntroduced"}];

  ledgend =
   Labeled[
    SwatchLegend[
     ColorData[{"Indexed", "VibrantColor"}] /@ Range[Length@verIntro],
      Reverse@Keys@verIntro,
     LegendLabel -> "Version",
     LegendLayout -> (Grid[Join @@@ Partition[Reverse@#, UpTo@2], Alignment -> Decimal] &),
     LabelStyle -> {FontColor -> Automatic, FontSize -> Medium}],
    Style[functionality, Black], Top,
    Frame -> True,
    FrameStyle -> LightGray,
    RoundingRadius -> 5];

  chart =
   SectorChart[
    MapAt[MapIndexed[Labeled[{1, 1}, Rotate[#, angle[First@#2], {1/2, 1/2}]] &, #] &, 1]@
     {
       Join @@ Values@verIntro,
       Sequence @@ (
         Join @@ {
             ConstantArray[Style[{1, .1}, Transparent], Last@#],
             ConstantArray[{1, .1}, Subtract @@ #],
             ConstantArray[Style[{1, .1}, Transparent],
              len - First@#]} & /@
          If[bolShowAllVersions,
           Rest@Partition[Append[0]@Riffle[Reverse@Accumulate@Values[Length /@ verIntro], 0], 2],
           Rest@Partition[Append[0]@Reverse@Accumulate@Values[Length /@ verIntro], 2, 1]
           ]
         )
       }[[
      All,
      Switch[plotOrdering,
       "Alphabetical", Ordering[Join @@ Values@verIntro],
       "Version Introduced", All,
       _, All
       ]
      ]]
    ,
    PerformanceGoal -> "Speed",
    SectorOrigin -> {Automatic, 1},
    SectorSpacing -> 0,
    ChartStyle -> {ColorData[{"Indexed", "VibrantColor"}] /@ Range[Length@verIntro], None},
    ChartBaseStyle -> {EdgeForm[LightGray]},
    Epilog -> {Inset[ledgend, {0, 0}]},
    BaseStyle -> {FontColor -> White}, ImageSize -> 1100
    ];

  busy = False;

  chart
  ,
  {{functionality, "AudioSymbols", "Functional Area"},
   AlphabeticSort@DeleteDuplicates@Flatten@EntityValue[WolframLanguageData[], "FunctionalityAreas"]},
  {{plotOrdering, "Version Introduced", "Plot By"}, {"Version Introduced", "Alphabetical"}},
  {{bolShowAllVersions, False, "All Versions"}, {True, False}},
  Button["Save Image",
   With[{filename =
      SystemDialogInput["FileSave", {FileNameJoin[{$UserDocumentsDirectory, functionality <> ".png"}],
        {"PNG Image" -> {"*.png"}, "JPEG Image" -> {"*.jpg", "*.jpeg"}}}] },
    If[filename =!= $Canceled,
     busy = True;
     Export[filename, Magnify[chart, 2]];
     busy = False;
     ]
    ],
   Method -> "Queued",
   ImageSize -> 85],
  Dynamic[
   If[busy == True,
    ProgressIndicator[Appearance -> "Indeterminate"],
    Spacer[{1, 1}]
    ]]
  ,
  TrackedSymbols :> {functionality, plotOrdering, bolShowAllVersions},
  SynchronousInitialization -> False,
  SynchronousUpdating -> False,
  Initialization :> (
    angle[n_] :=
     Piecewise[{
       {(-(Pi/2))*((n - 1)/quads[[2]]), n <= quads[[2]]},
       {Pi/2 - (Pi/2)*((n - quads[[2]])/(quads[[3]] - quads[[2]])), n <= quads[[3]]},
       {2*Pi - (Pi/2)*((n - quads[[3]])/(quads[[4]] - quads[[3]])), n <= quads[[4]]},
       {Pi/2 - (Pi/2)*((n - quads[[4]])/(quads[[5]] - quads[[4]])), n <= quads[[5]]}
       }]
    )
  ]]
Have fun discovering.


