If you take a look at the dimensions of your data you will notice that it is wrapped into an additional layer (which could mean that it is kind of a 3D structure --- list of data):
data = Import["~/Downloads/test.nc",  {"Datasets",  "SST"}];
Dimensions[data]
(* ==> {1, 801, 1001} *)
So what you want to do here to plot the data, is getting rid of additional layer, which can be done as easy as:
data = First[data];
Dimensions[data]
(* ==> {801, 1001} *)
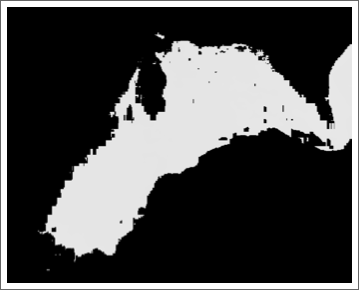
Now you can plot the data:
ArrayPlot[data]
Or you could plot it as it is:
ArrayPlot /@ data
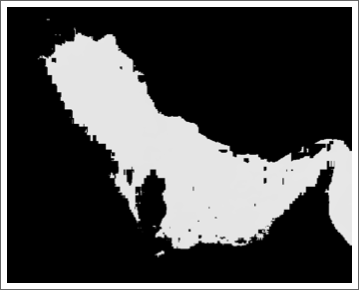
All the rest, in the example from the documentation I refereed to, is matter of preference. For example here is how it looks when you reverse your data:
ArrayPlot[Reverse[data]]
Or, here is how the ColorFunction actually influences your plot:
ArrayPlot[Reverse[data], ColorFunction -> "BlueGreenYellow"]

And so on, so force.
p.s. Please consider removing External Programs and Systems from your question's keywords, since it is not related to your question.


