I use Wolfram Language as a Deep Learning framework. When I joined "Machine Learning Webinar Series" in April, I knew that many participants used open source Deep Learning frameworks in the questionnaire before the start. TensorFlow is used by around me, but I didn't know PyTorch is popular. So I checked the popularity of Deep Learning framework : TensorFlow, Caffe, PyTorch, CNTK, MXNet. The method is the number of stars of each GitHub repository. It is so easy for Wolfram Language to scrape, crawl and visualize them like star-history.
Access token
The GitHub API has the following restriction. I will call many api from now on, so I need to get an access token.
For API requests using Basic Authentication or OAuth, you can make up to 5000 requests per hour. For unauthenticated requests, the rate limit allows for up to 60 requests per hour.
token = "token abcdefghijklmnopqrstuvwxyz0123456789abcd"; (* sample *)
Total number of stars
In the case of TensorFlow the total number of the stars and the date when the last star has been updated can be found below.
totalstarsURL[r_String] :=
  StringTemplate["https://api.github.com/repos/`r`"][<|"r" -> r|>];
gettotalstars[r_String] := Module[{req, res},
  req = HTTPRequest[totalstarsURL[r],
      <|"Headers" -> {"Authorization" -> token}|>];
  res = Association@Import[req, "JSON"];
  {DateObject@res["updated_at"], res["stargazers_count"]}
  ]
gettotalstars["tensorflow/tensorflow"]

History of star-gazers
The URL that gets 100 star-gazers per one page is
stargazersURL[r_String, n_Integer] :=
  totalstarsURL[r] <> "/stargazers?page=" <> ToString[n] <> "&per_page=100";
The URL that collects the first 100 star-gazers of TensorFlow is
stargazersURL["tensorflow/tensorflow", 1]

The GitHub API will tell me the maximum number of pages in the Link Header.
getpageMax[r_String] := Module[{req, res, max},
  req = HTTPRequest[stargazersURL[r, 1],
      <|"Headers" ->
      {"Authorization" -> token,
       "Accept" -> "application/vnd.github.v3.star+json"}|>];
  res = URLRead[req, "Headers"];
  max = StringCases[(Association@res)[["link"]],
     RegularExpression["next.*?page=(\\d+).*?last"] -> "$1"][[1]];
  ToExpression[max]
  ]
getpageMax["tensorflow/tensorflow"]

The total number of the stars of TensoFlow is 100,266. So the number of pages could be 1,003(100,266/100). However, the maximum is 400 due to the restriction of the GitHub API.
I define the function that gets one -page and all the pages. Then I define the function that gets the date when each star has been updated from pages.
getpage[r_String, n_Integer] := Module[{req, res},
  req = HTTPRequest[stargazersURL[r, n],
      <|"Headers" ->
      {"Authorization" -> token,
       "Accept" -> "application/vnd.github.v3.star+json"}|>];
  Association /@ Import[req, "JSON"]
  ]
getpages[r_String] := Module[{pageMax, pages},
  pageMax = getpageMax[r];
  pages = getpage[r, #] & /@ Range[pageMax]
  ]
getstardates[pages_List] := Module[{res},
  res = #["starred_at"] & /@ Flatten[pages];
  Select[DateObject /@ res, DateObjectQ]
  ]
Now that we are ready, let's get all pages and dates on TensorFlow.
pages = getpages["tensorflow/tensorflow"];
dates = getstardates[pages];
I convert these dates into a list for DateListPlot. However, I need to consider that I can only get up to 40, 000(400*100) dates. That is, if the total number of stars exceeds 40, 000, I need to append the date of the last star and the total number of stars to the list. All the dates are unnecessary if it is only to show a history of stars, some samples are enough like star-history. However, I will use all the pages for another purpose later.
plotlist[r_String, dates_List] :=
 Module[{pageMax, total, lastdate, pl},
  pageMax = getpageMax[r];
  {lastdate, total} = gettotalstars[r];
  pl = Transpose[{dates, Range[Length[dates]]}];
  If[pageMax == 400 && dates[[-1]] != lastdate,
   AppendTo[pl, {lastdate, total}], pl]
  ]
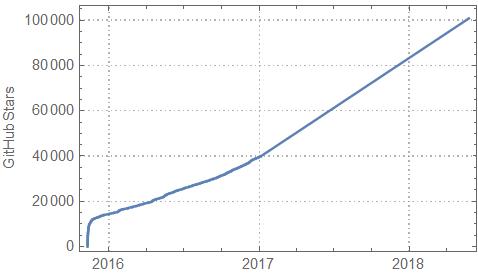
Let's show the history of stars of TensorFlow.
tfd = plotlist["tensorflow/tensorflow", dates];
DateListPlot[tfd, "Day", PlotRange -> All,
 FrameLabel -> {None, "GitHub Stars"}, PlotTheme -> "Detailed"  ]
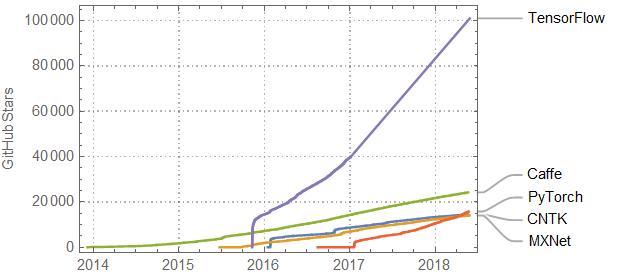
The similar processes are performed for MXNet, CNTK, Caffe and PyTorch. As of May 2018 it is as follows. TensorFlow is overwhelming popular, and PyTorch seems to be high attention recently. This trend is the same as the above questionnaire result.

Further : Locations of star-gazers
I continue to use the GitHub API. I check the locations of star-gazers.
First of all, I will get URLs of star-gazers from all the pages.
getpersonURLs[pages_List] := Module[{},
  Union[("url" /. ("user" /. #)) & /@ Flatten[pages]]
  ]
purls = getpersonURLs[pages];
Next, I will get location information from each page of star-gazers.
getlocations[url_String] := Module[{req, res, loc},
  req = HTTPRequest[url,
      <|"Headers" -> {"Authorization" -> token}|>];
  res = Import[req, "JSON"];
  loc = "location" /. res
  ]
In the case of TensorFlow the number of URLs of star-gazers is 40,000, so it may have to be splitted every 5,000 in one hour depending on the network performance.
locs = getlocations /@ purls;
And then I will get the country names from them by using SemanticInterpretation. Since the city name may be written as a location, I will get the country name from the city name with EntityValue.
getCountry[loc_String] := Module[{s, tmp},
  s = SemanticInterpretation[loc];
  tmp = If[s[[1]] == "Country", s, EntityValue[s, "Country"]]
  ]
countries = getCountry /@ locs;
Because countries contain noises that are not country names, I remove this noise. And then I select Top 8.
s = Select[countries, SameQ[#[[1]], "Country"] &];
country8tf = Sort[Tally[s], #1[[2]] > #2[[2]] &][[1 ;; 8]]

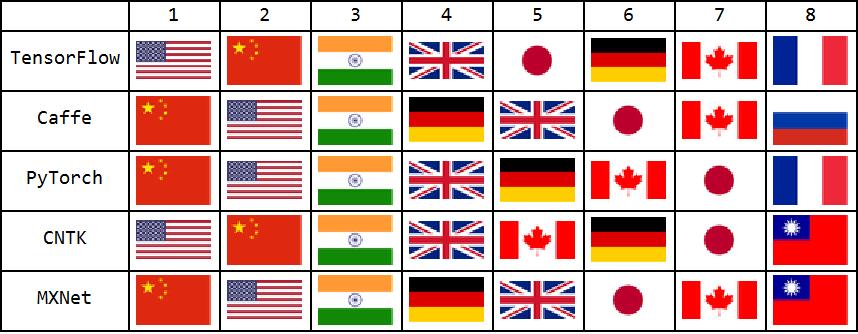
I will visualize this a little more with the flags.
Grid[{Prepend[Range[8], ""],
  Prepend[
   ImageResize[#, 50] & /@ (#["Flag"] & /@
      Transpose[country8tf][[1]]), "TensorFlow"]}, Frame -> All]

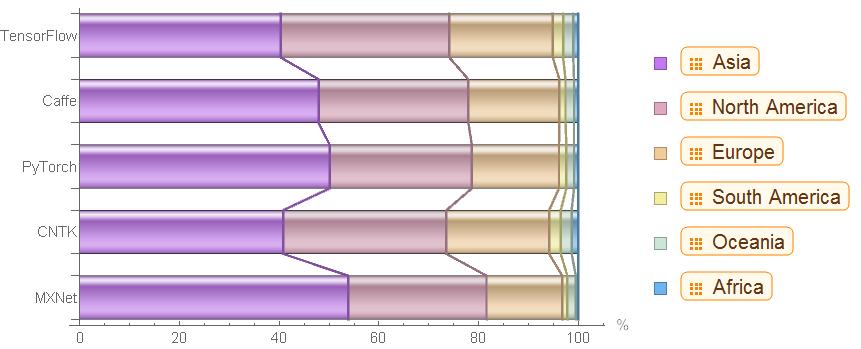
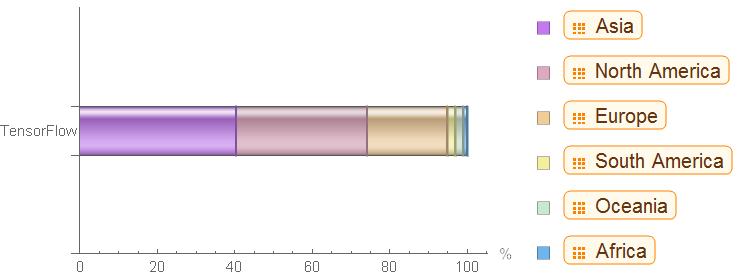
It can be easily visualized by continent.
continents = {EntityClass["Country", "Asia"],
   EntityClass["Country", "NorthAmerica"],
   EntityClass["Country", "Europe"],
   EntityClass["Country", "SouthAmerica"],
   EntityClass["Country", "Oceania"],
   EntityClass["Country", "Africa"]};
continentcountries = CountryData /@ continents;
classifycontinents[c_, continentcountries_] := Module[{},
  Boole /@ (IntersectingQ[{c}, #] & /@ continentcountries)
  ]
Japan is classified as Asian Continent.
classifycontinents[Entity["Country", "Japan"], continentcountries]

All countries are classified by continent and visualized its distribution by BarChart.
tt = Total[classifycontinents[#, continentcountries] & /@ countries];
continentstf = N[#, 3] & /@ (tt*100/Total[tt]) ;
Grid[{{BarChart[{continentstf}, ChartLayout -> "Stacked",
    BarOrigin -> Left, Joined -> True, BarSpacing -> 0.5,
    ChartElementFunction -> "GlassRectangle", ChartStyle -> "Pastel",
    ChartLabels -> {{"TensorFlow"}, None}, AxesLabel -> "%"],
   SwatchLegend["Pastel", continents]}}]
The similar processes are performed for MXNet, CNTK, Caffe and PyTorch. As of May 2018 it is as follows.
