Is there a way to specify how overlapping plots are displayed?
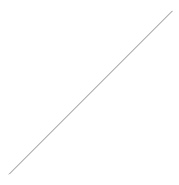
Graphics[{Thickness[0.002], Line[{{{0, 0}, {5, 5}}, {{1, 1}, {4, 4}}, {{2, 2}, {3, 3}}}]}]
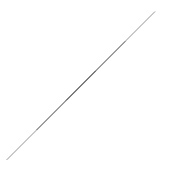
It's subtle, but overlapping portions of the lines are thicker. It would be nice for some applications if we could specify such that there is no added thickness, so it would look more like:
Graphics[{Thickness[0.002], Line[{{{0, 0}, {5, 5}}}]}]