The process of learning has exercised humanists since ancient times. If the ability to learn is not what separates us from the beasts and the broccolis, what is, they asked? Of course, we have long since recognized that we are not the only learners on the planet, but we are still limited in our understanding because it is hard to look inside a living brain to see what is going on in there. Now, however, we have a new member of the community of learners: the computer running a neural network algorithm. And this is a learner that we can, with a little training, look inside of. Doing so does not provide direct answers to the way we think, but it stimulates wonderful questions. For example, deep learning uses the so-called "back propagation" algorithm. Do we? The neural network pioneer Geoffrey Hinton opines that evolution could have discovered back prop. Maybe some day soon we will know if it did. Or if it tumbled to something better. We should be equipping every student to ask these kinds of questions, not just those who will go on to major in machine learning in college. How do we do that?
What Exactly Is So Hard About Neural Networks?
The algorithm inside an individual network node is no great shakes. Multiply the values of a training example by some weights, add a bias, run it through a simple nonlinear step and ship the results to the next nodes in the network. This mathematics is well within the scope of high school Algebra II.
In fact, neural networks are hard for high school students for a variety of reasons, starting with their cultural incompatibility. We are taught to process the world in a top-down manner, starting with the most general and working down to the particulars only at the end. Rene Descartes called this approach Method. Not one method among many, but Method itself with a capital "M."
Once students accept that reality goes both ways and that bottom-up approaches are just as valid as top-down ones, there are still mathematical obstacles to understanding neural nets. There is, for example, no simple way to express a graph in an equation. You have to see it and, in the case of students, play around with it, adding a layer here and trimming off a node there to get comfortable. The presentation has to be visual, not textual.
The same goes for the output of a network. A "percentage of correct answers" number is a useful bottom line, but does not help understand how it came about. A neural net actually guesses the correct answer for every single training example, a reality that also benefits from visual presentation.
Training a neural network in the Wolfram Language is no hard task. Provide the "NetTrain" function with a network topology and some training data and it will crush the problem. Writing the code to do a very simple neural network learning process is also well within the capacity of a high-school Algebra II student. The Wolfram Language apps that this post references seek to visualize and explain how we get from one to the other.
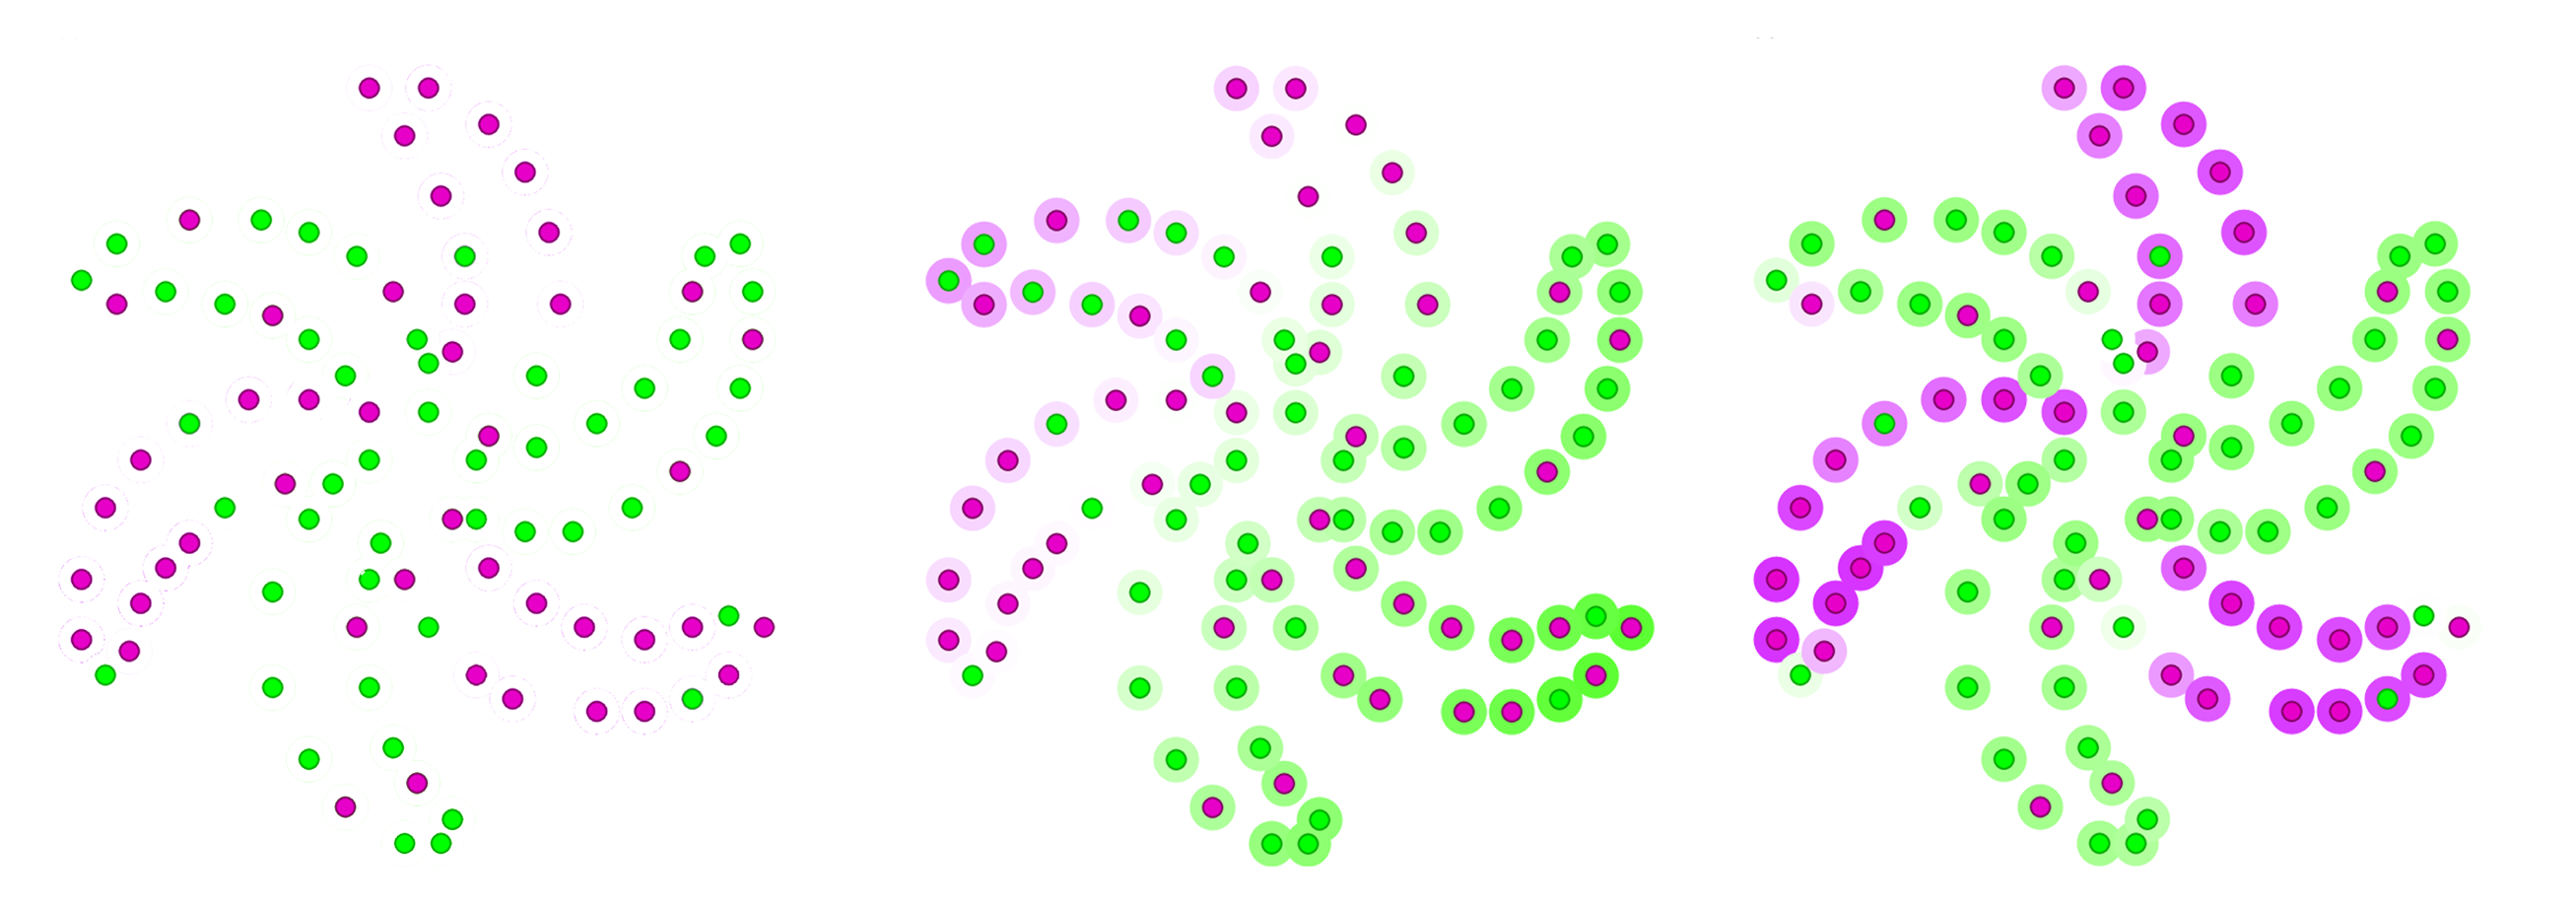
To teach neural networks, it helps to start at the end, experiencing both a very simple one and a very sophisticated one. The "Visualizing Neural Network Results" notebook shows the difference.
At the bottom of the code is a "doLearn" function call. Call it with a parameter of "0" and it runs the simplest possible neural network. Run it with a parameter one "1" and it invokes NetTrain.
The form of the output is explained below, but there are a few elements of the Wolfram Language code that are worth noting first. Up top is a list of three-element lists that define the pinwheel that is shown in the result. The first two numbers are {x,y} coordinates; the third indicates the color at that spot: green or purple.
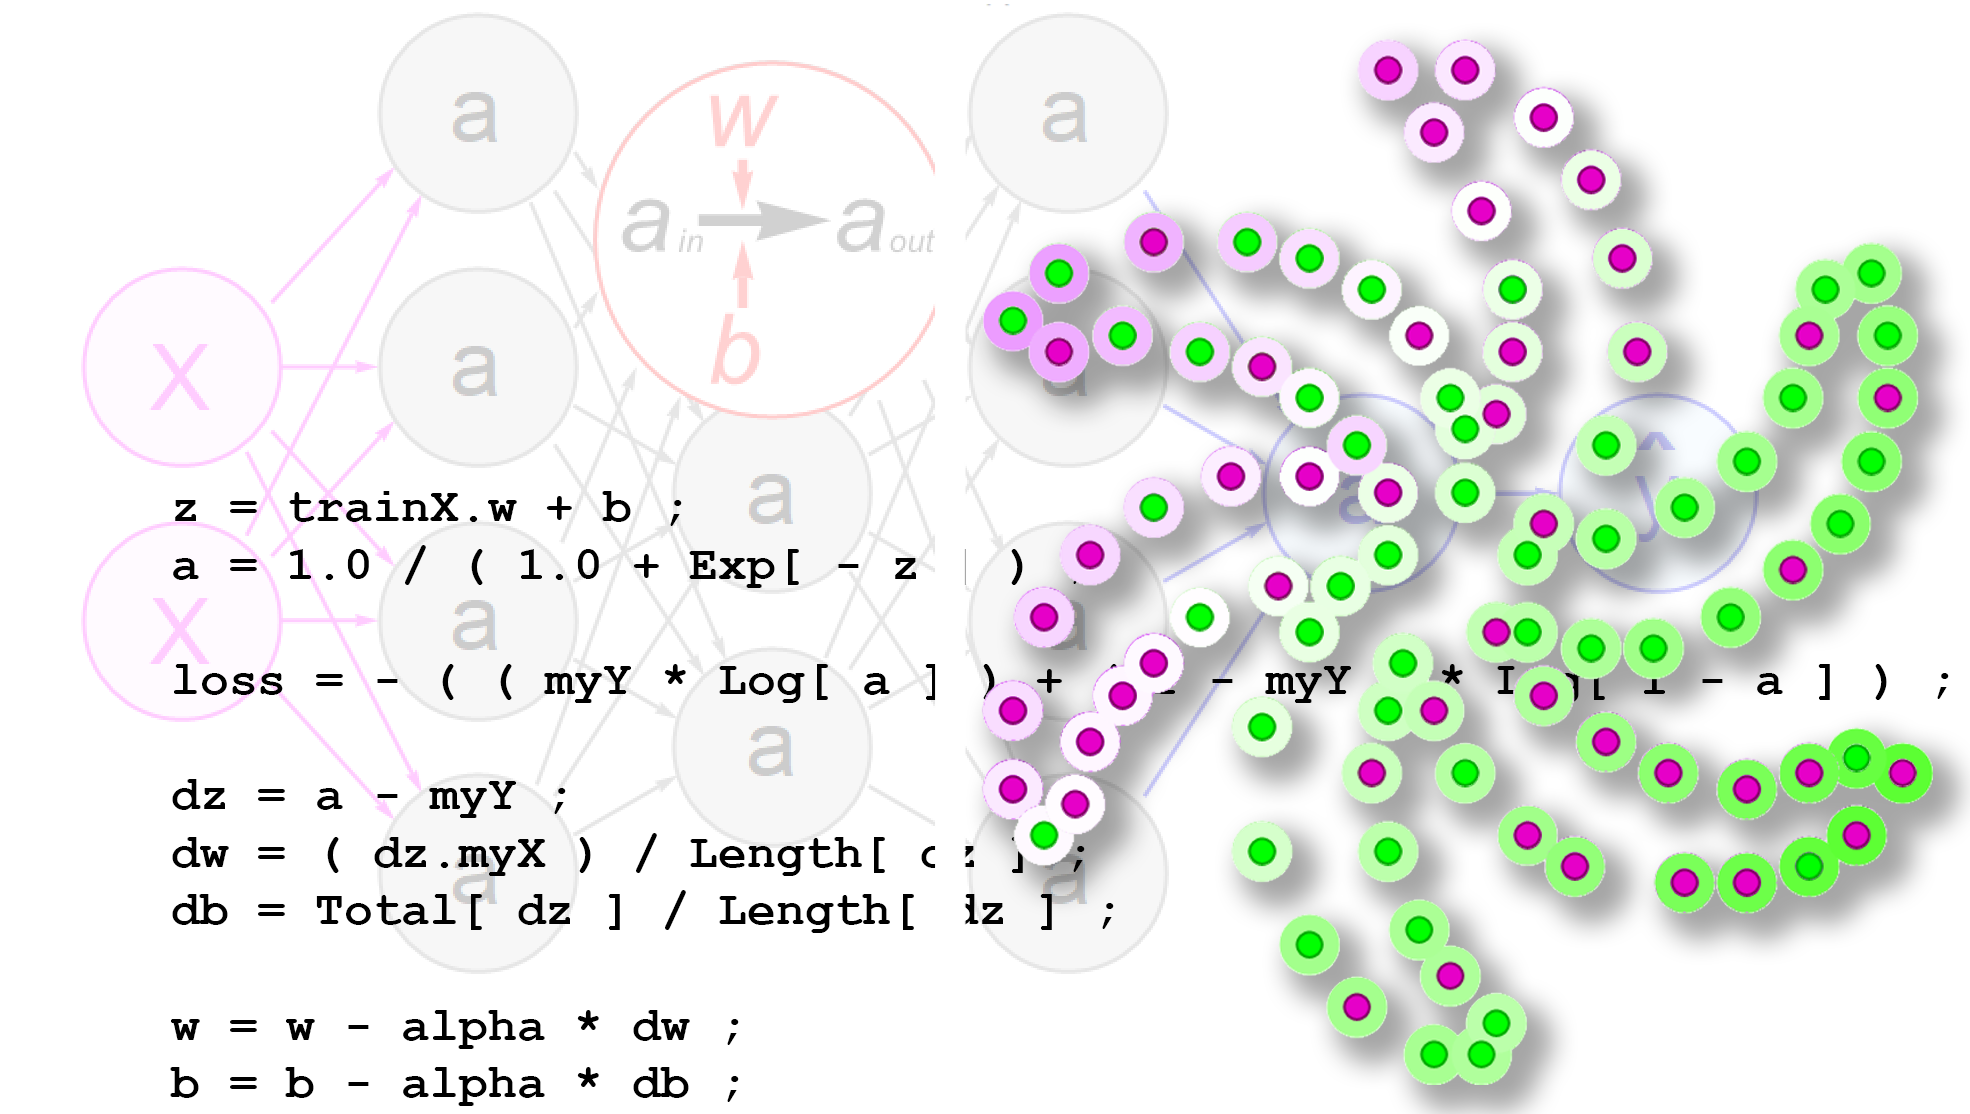
The function that invokes NetTrain is self-explanatory. The function that does the simple logistic regression version is interesting simply for its simpleness. Nothing hard here. A remarkable example of the crispness of the Wolfram Language comes near the bottom with:
EdgeForm[], Transpose[{Hue /@ haloHues , Disk @@@ guessHalo}] ,
This single line is positioning the halo behind each dot in the pinwheel, coloring it green or purple depending on what the network is guessing, and making each individual halo brighter or dimmer depending on how close that guess is to a totally ambivalent 0.50. All based on two lists: "halohues" and "guessHalo."
The logistic regression app does not learn much but it does learn. As shown in the middle image above, it draws a line diagonally through the pinwheel, capturing two purple blades on one side and two green ones on the other, and hinting that they are indeed purple or green dots.
NetTrain crushes the problem, putting a bright green halo around most all of the green dots and a correspondingly bright purple one around most of the purple dots, as shown in the right-most image above. This way of visualizing the results highlights the reality that a neural net learning algorithm puts out a guess about every training value whether it has a clear view of it or not. This "do all the data" reality can be expressed very compactly and cleanly in the Wolfram Language.
At this point, the student has some concrete understanding of what it means for a neural network to "learn." It s not an all-or-nothing situation for the computer any more than it is for us. Like us, the algorithm is petty sure in some places, pretty clueless in others, and confidently wrong in still others. Now the student is ready to learn about what makes the difference in algorithm performance.
Now we shift to the second app, which visualizes the actual behavior of neural networks.
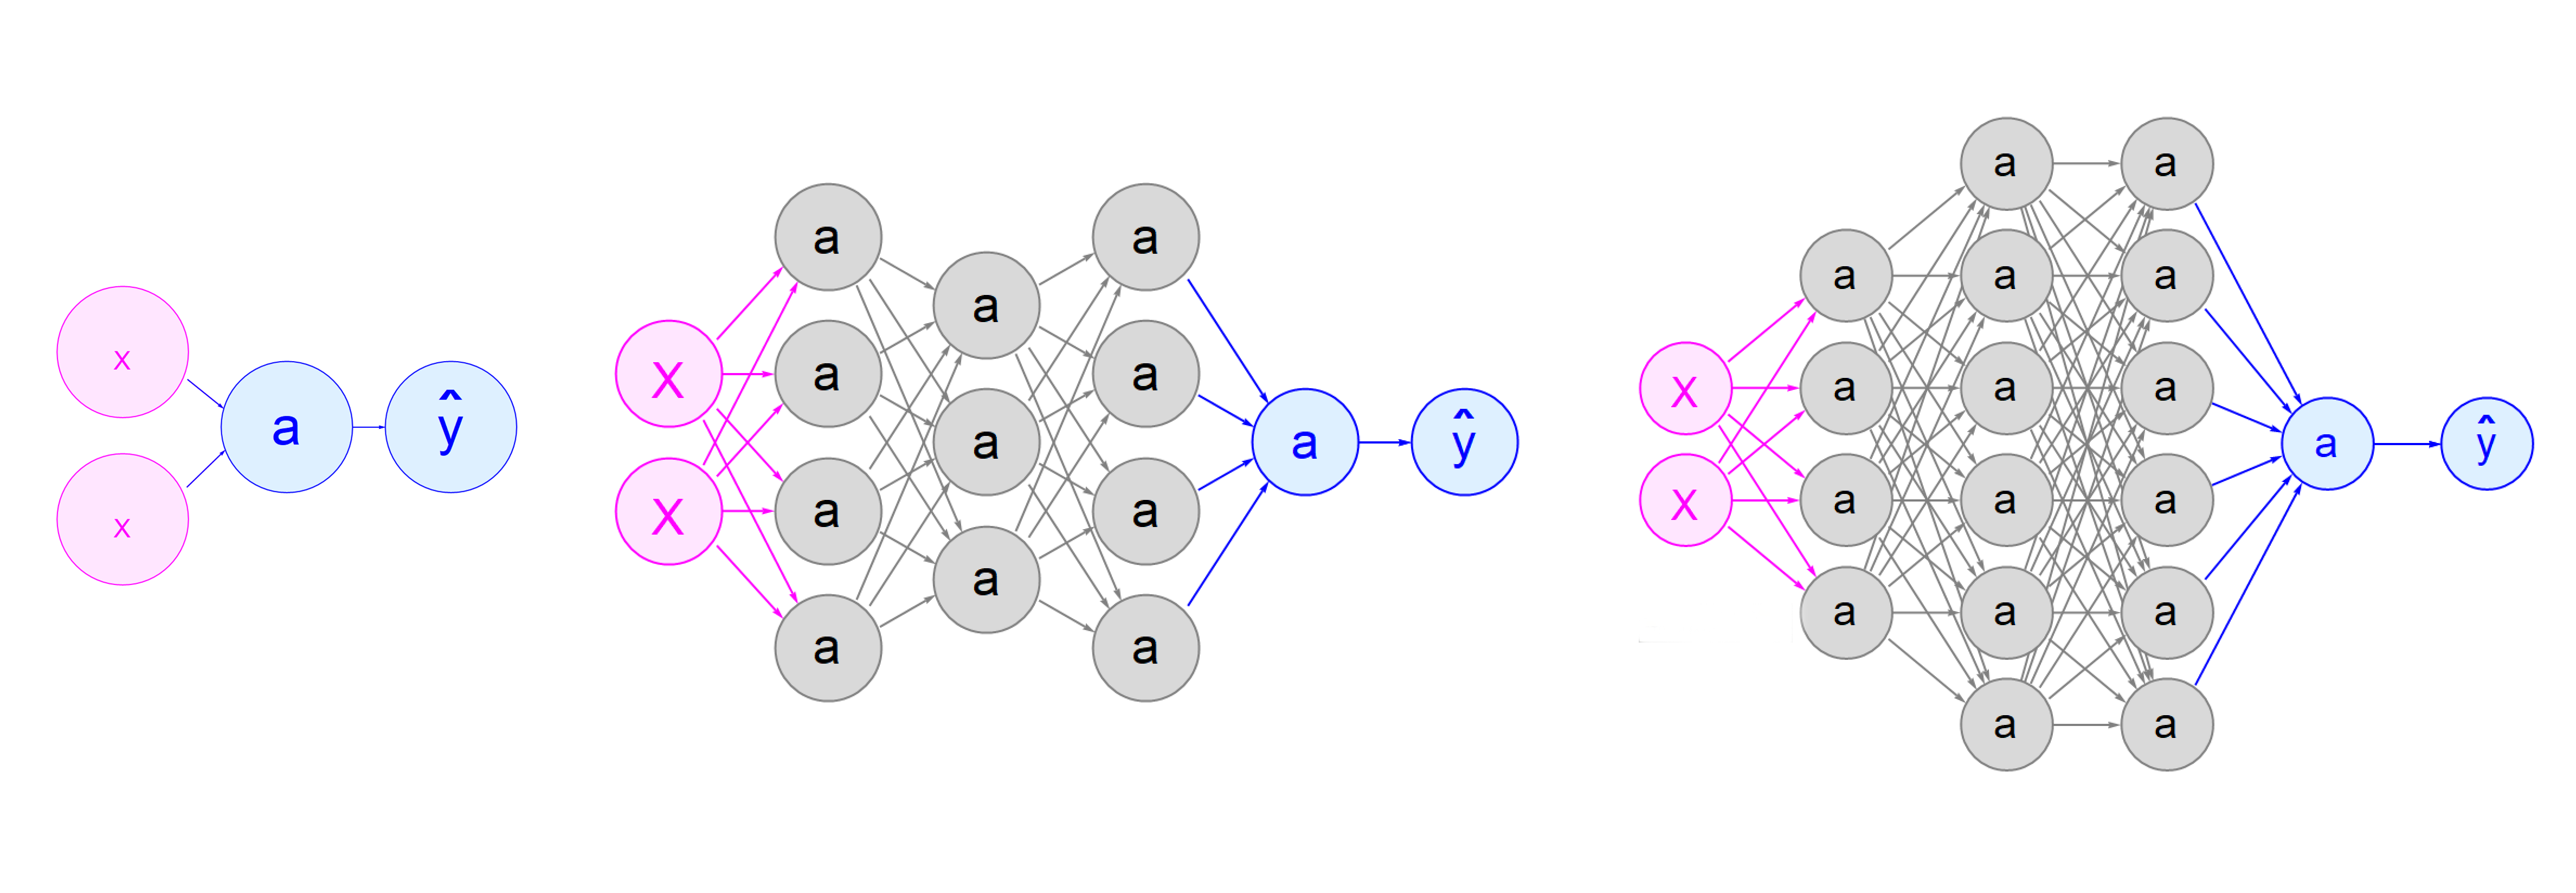
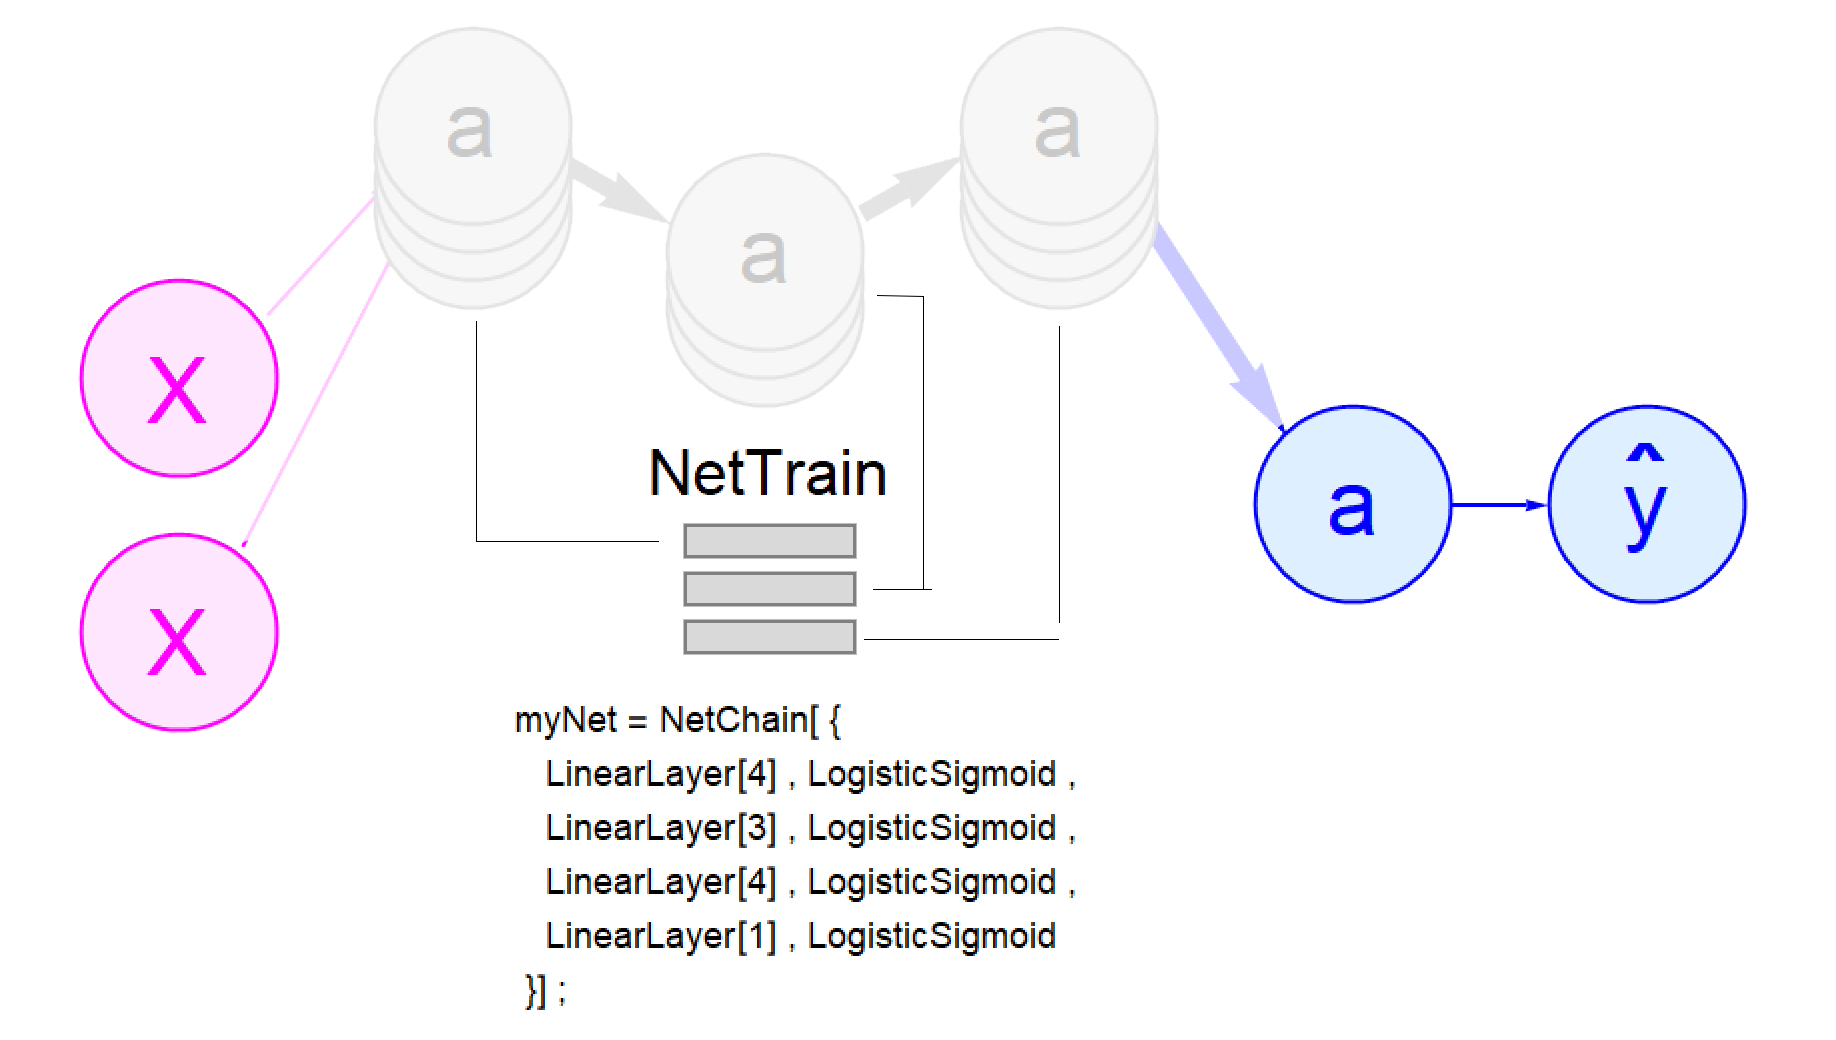
Using the convention of characterizing neural networks by a list of node counts, the app allows the user to add and subtract whole layers and/or add and subtract nodes from existing layers. The more values in the list, the more layers in the network. The bigger the individual values, the more nodes in the corresponding layer.
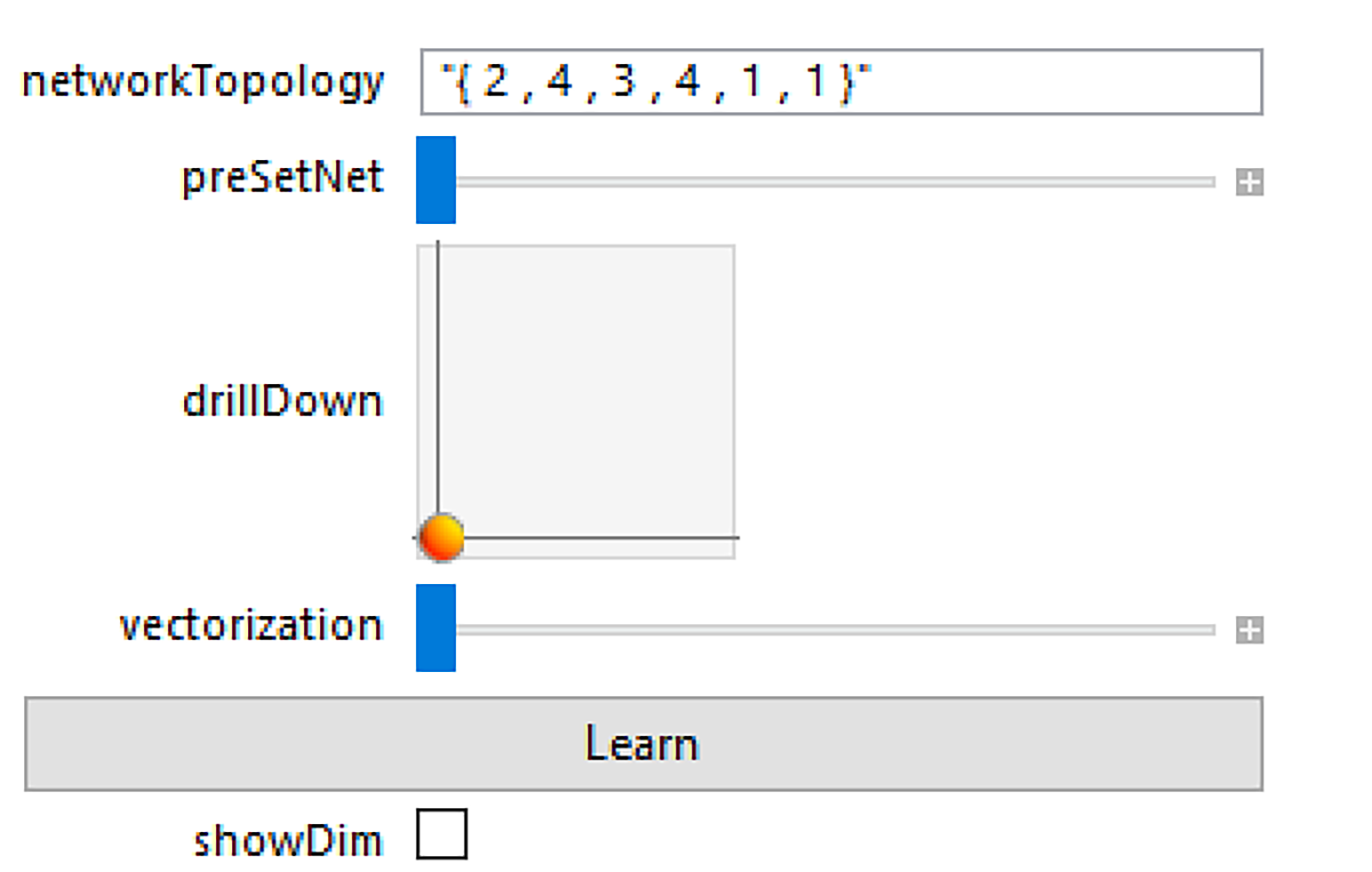
For convenience there are three "pre-sets" as examples. The first position keeps the "{2,4,3,4,1,1}" default. The second shows the simple logistic regression graph. The third recapitulates the default. The fourth shows a bigger network similar to the one used by NetTrain.
The drillDown pointer offers a unique, and important, view of neural networking by drilling down into an individual node and showing the algorithm inside. The algorithm is the same in each node, but the size and shape of the data flowing in and out, and the size and shape of the weights and biases that influence that flow, are not. To help students, the "showDim" checkbox offers to add in formation about those data structures. Each is a list of lists. The added information indicates how many sublists are in each list and how many vales are in each of these sublists. 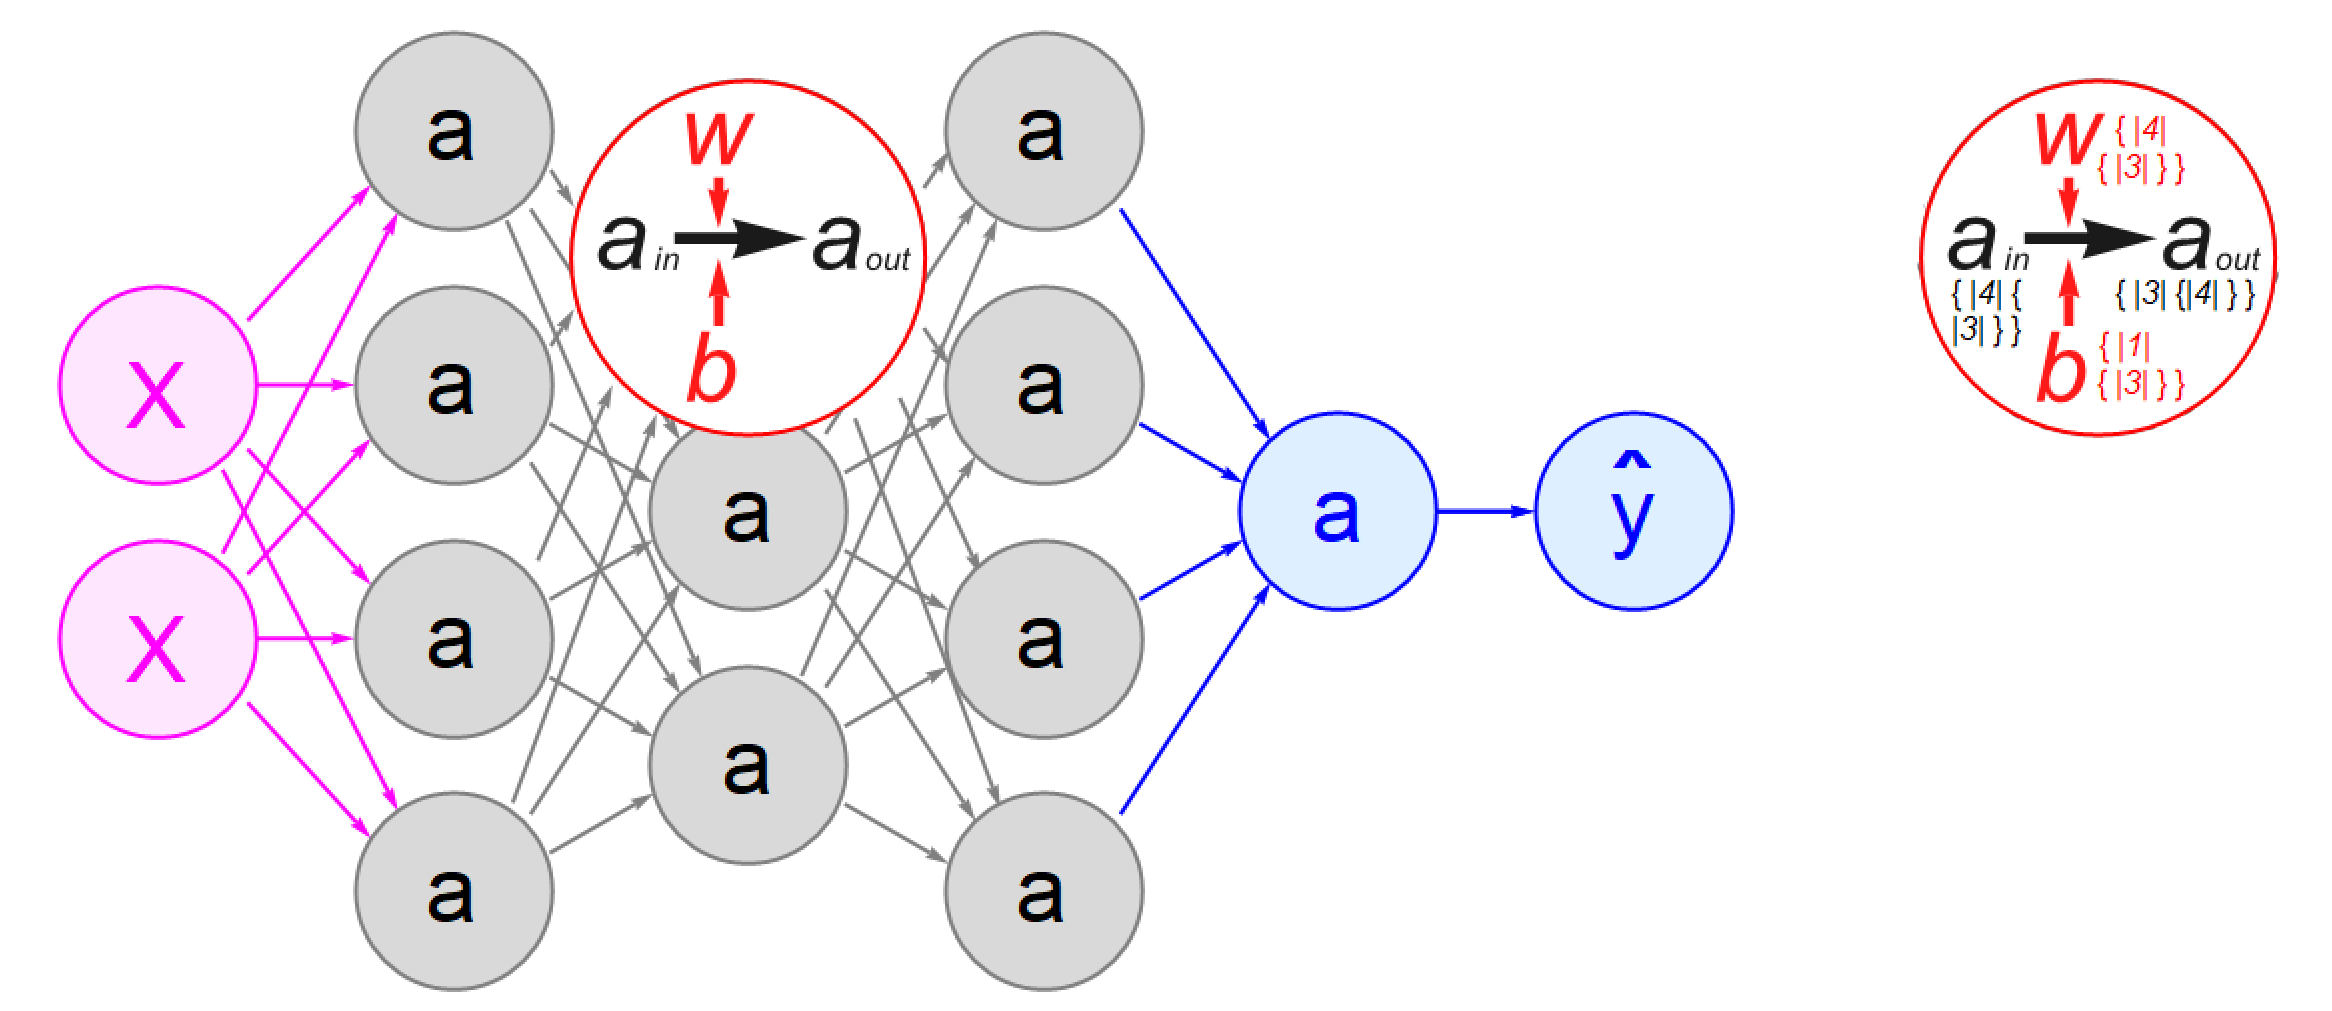
The "vectorization" slider animates the otherwise confusing way that typical neural network implementations actually pack all the data about a whole layer in one place; figuratively in the top node of each layer. Instead of a little bit of data passing between lots of nodes, a lot of data now flows through these collective nodes.
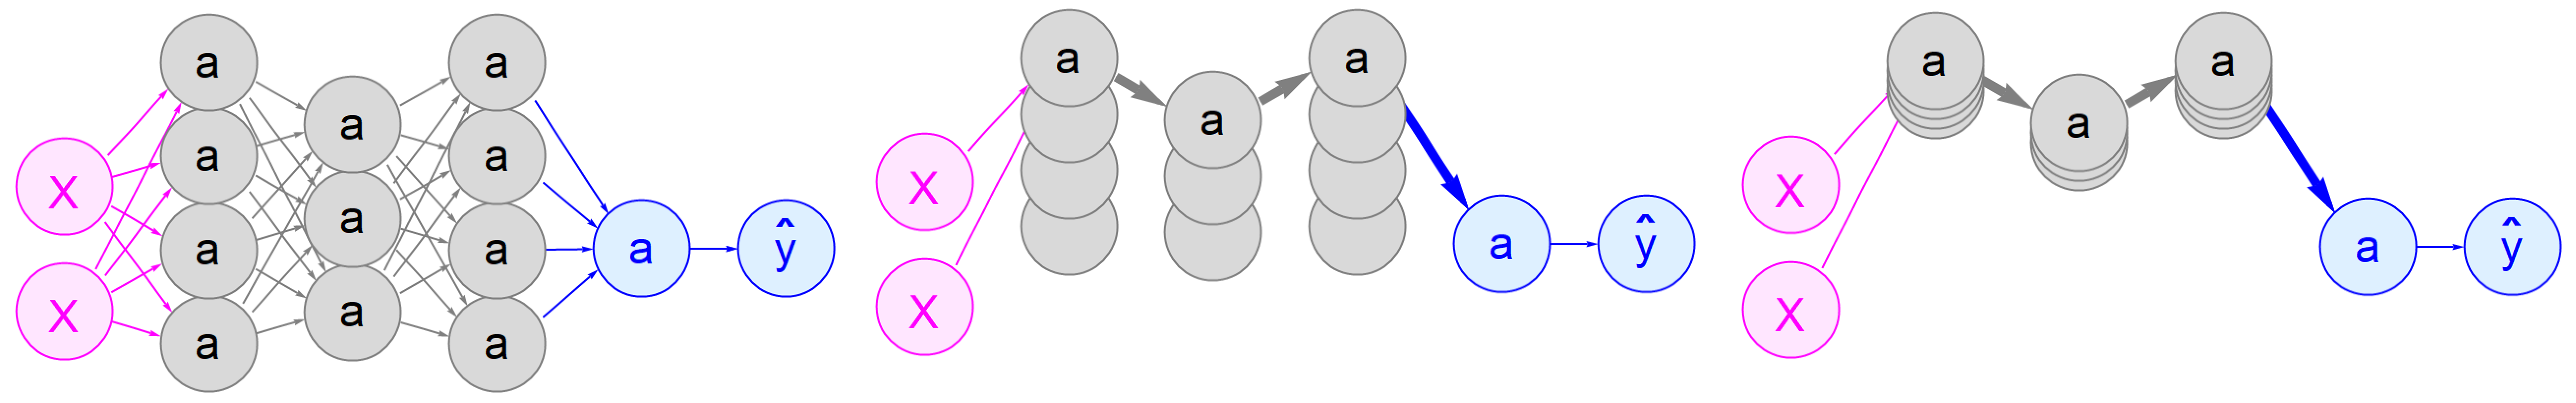
Once the "vectorization" slider gets to its midpoint, packing all the layer nodes together, it switches to the job of showing how these packs are actually identical to the layer boxes visualized by the NetTrain function. In a way, this transition is refreshing. There is something disorienting about lining up neural networks "layers" horizontally. Layers are supposed to stack vertically, like layer cakes. NetTrain knows this.
The Gregor Mendel Of Bottom-up Habits Of Thought
Assuming at this point that a high school student has a sense of what a neural network is all about, why does it matter more widely? To understand the power and generality of this new way of thinking, it can be useful to look back to George Sturt, who was doing so in obscurity a century ago.
Theology starts with God creating all things, then works down to 'mere' dust, 'mere' atoms, 'mere' matter. And we talk of these things scornfully, as if there was nothing wonderful in them... But what if we begin at the other end? How if we acknowledge... this splendour in 'Dust,' in atoms, in matter, that (perhaps as outcome of its inscrutable nature) it works itself up by some unknown and unknowable urge, into Stellar universes, into Life, into Friendship, into fancy that imagines 'God'?... and the thing that theology despises turns out to be beyond words splendid, beyond the utmost reaches of thought mysterious and beautiful.
He understood just as clearly that the community of wheelwrights in his area comprised their own neural network.
The lore was a tangled network of country prejudices, whose reasons were known in some respects here, in others there, and so on. In farm-yard, in tap-room, at market, the details were discussed over and over again; they were gathered together for remembrance in village workshop; carters, smiths, farmers, wheel-makers, in thousands handed on each his own little bit of understanding, passing it to his son or the wheelwright of the day, linking up the centuries. But for the most part the details were but dimly understood; the whole body of knowledge was a mystery, a piece of folk knowledge, residing in the folk collectively, but never wholly in any individual.
And, perhaps most insightfully, he saw that behavior that emerges from these individuals requires a new means of expression. The legacy words and numbers of his day were not up to the task.
The [individual] organism doing its work, instinctively and well: and so the family, another organism, doing equally well... it does call for a new art, yet to be invented for recording such things.
We now have that new art available to us, and every school child needs to be introduced to it.


