In this project, we created a function that takes in student solutions to arbitrary EIWL problems, collects the key components of the solutions, and clusters the solutions in order to understand common approaches to solving (or failing to solve) each problem. We performed a truncated principal component analysis on the results so we could visualize the locations of these clusters in the space of symbol use.
We began with student submissions to problems from the online EIWL textbook: https://www.wolfram.com/language/elementary-introduction/2nd-ed/
Taking a specific problem, we could view student submissions in their raw form. Take for example the EIWL problem 3.6, "Plot a list that counts up from 1 to 100, then down to 1." Here are some of the student submissions:
submittedCells = Normal@probdata[All, "UserSubmission"];
justCellData = submittedCells /. Cell[a_, ___] :> Cell[a];
RawBoxes /@ justCellData
ListPlot[Join[Range[100], Reverse[Range[99]]]]
ListPlot[Join[Range[100], Reverse[Range[100]]]]
ListPlot[Join[Range[100], Reverse[Range[99]]]]
ListPlot[Join[Range[100], Range[1]]]
ListPlot[Join[Range[100], Reverse[Range[99]]]]
Join[Range[100], Reverse[Range[100]]]
Join[Range[100], Reverse[Range[99]]]
ListLinePlot[Join[Range[100], Reverse[Range[99]]]]
ListPlot[Range[100], Reverse[Range[100]]]
Already we can see a number of strategies and errors. Some learners double-counted 100 in their list. Some used Join but did not plot, others use ListPlot but did not join.
We can get further by viewing the total counts of all the functions and symbols used across all the solutions:
fillBags[expr_] :=  Level[expr, {-1}, Heads -> True] /. ExpressionCell | HoldComplete | CompoundExpression | Null -> Nothing
bags = Map[ToString, fillBags /@ Select[MakeExpression[justCellData, StandardForm], FreeQ[ErrorBox]], {2}];
ReverseSort@Counts@Flatten@Join@bags
Some highlights from this list include the most common, and the least common terms:
"Range" -> 11903,
"100" -> 10141,
"Reverse" -> 5951,
"Out" -> 11,
"reverse" -> 10,
"listplot" -> 6,
"MeineListe" -> 4,
"https://www.wolfram.com/language/elementary-introduction/2nd-ed/\Files/answers-to-exercises-io_3.6_in.en.png" -> 4,
"ListLinePlotPlot" -> 4,
"RandomInteger" -> 3,
"Rang" -> 2,
"Histogram" -> 1
"LisPlot" -> 1,
"ListLiPlot" -> 1,
"LostPlot" -> 1,
"Loistplot" -> 1,
"http://www.wolfram.com/wolfram-u/an-elementary-introduction-to-the-\
wolfram-language/transcripts/Files/03-first-look-at-lists-inputonly3.\
en.png" -> 1
Many of the rare terms turn out to be typos (Rang, LisPlot, LostPlot), miscapitalization (reverse, listplot), or unique variable names (MeinListe). Some more surprising terms include functions that aren't relevant to the problem (RandomInteger, Histogram), and entertainingly, a URL pointing to an image of the solution to the problem.
We would like to better understand these submissions by finding a way to cluster them together. We first exclude rare words from the bags, and use ClusterClassify to do the rest.
allWords = Union@Flatten@bags;
commonWords = Keys@Select[AssociationMap[Count[bags, {___, #, ___}, {1}] &, allWords], # > 0.01 Length@goodSyntax &];
cleanBags =  Replace[bags, word_ /; Not@MemberQ[commonWords, word] -> Nothing, {2}];
clusters = ClusterClassify[cleanBags]
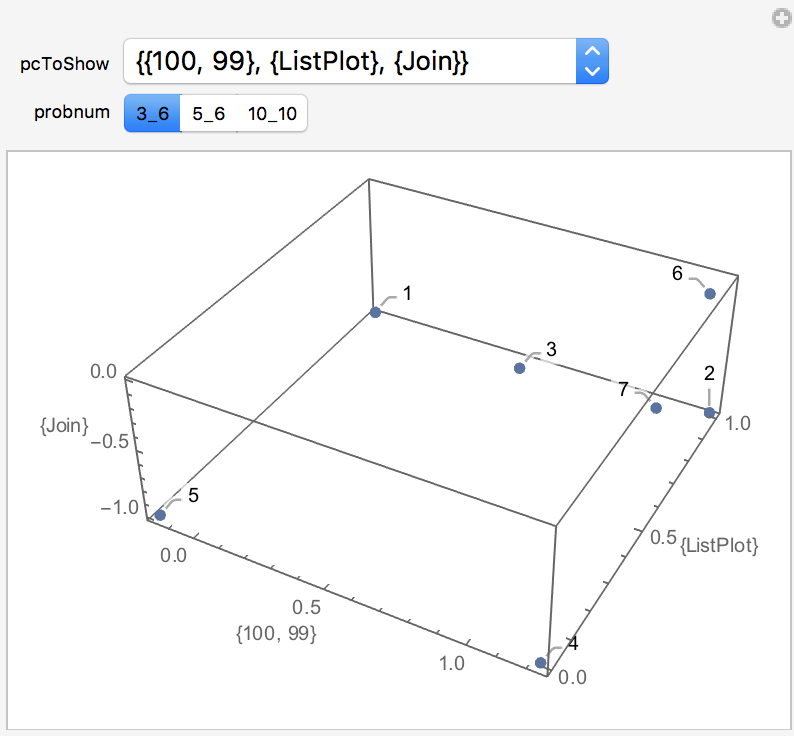
The value of clusters here is just a list of integers that identify the cluster of each point. What we really want to do is create a function to generate these clusters automatically, and then visualize what these clusters represent. I included in the notebook liked at the bottom of this post how I was able to do that. Taking a look specifically at problem 3.6, we can see what distinguishes the clusters from one another:
We intend to go much deeper into analyzing this data, as well as data from the Wolfram Challenges. We will explore the graph representation of code to generate additional distance metrics for clustering, look at performance of users over time and over problems, and generate automated suggestions for students that fail an assignment that explain how other students approached the problem similarly were able to ultimately be successful (for example, by directing them to documentation of a function they are not using).
Github notebook: https://github.com/lauren897/Summer2018Starter/blob/master/Lauren-Berk-Project.nb


