Message Boards Message Boards

0
|
5877 Views
|
2 Replies
|
1 Total Likes
View groups...
Share
Share this post:

Histogram plot

Posted 6 years ago

Hi, I have datas as follows,

data={(1,2),(2,4),(3,6),(4,8),(5,10),(61,2),(7,8),(8,6),(9,3),(10,2)}

I want to plot a histogram of this data.

Best Regards,

Kemal

POSTED BY: Kemal Kok
2 Replies
Posted 6 years ago

I'm assuming that the first element is either the midpoint for a histogram bar or the integer value that the variable of interest takes and the second element is a count. (Also, I'm pretty sure that {61,2} should have been {6,12}.)

data = {{1, 2}, {2, 4}, {3, 6}, {4, 8}, {5, 10}, {6, 12}, {7, 8}, {8, 6}, {9, 3}, {10, 2}};
BarChart[data[[All, 2]], ChartLabels -> data[[All, 1]]]
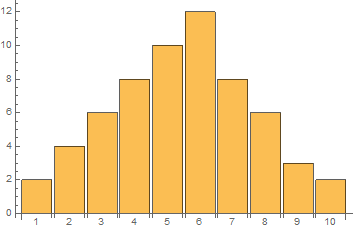
Bar chart

If the values 1 through 10 are not just discrete values but rather midpoints of the histogram bars (meaning the the underlying distribution is continous), then removing the spacing between bars would be more appropriate.

BarChart[data[[All, 2]], ChartLabels -> data[[All, 1]], BarSpacing -> None]
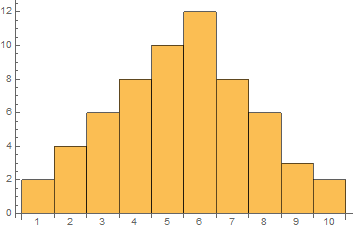
Bar chart with no spacing

POSTED BY: Jim Baldwin
data = {{1, 2}, {2, 4}, {3, 6}, {4, 8}, {5, 10}, {61, 2}, {7, 8}, {8, 6}, {9, 3}, {10, 2}}; 
Histogram[data]

histogram

POSTED BY: Mikayel Egibyan
Reply to this discussion
Community posts can be styled and formatted using the Markdown syntax.
Reply Preview
Attachments
Remove
or Discard

Group Abstract Group Abstract