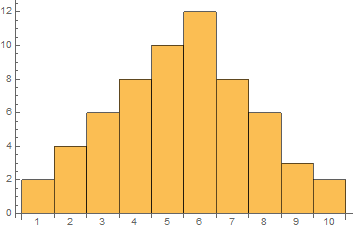
I'm assuming that the first element is either the midpoint for a histogram bar or the integer value that the variable of interest takes and the second element is a count. (Also, I'm pretty sure that {61,2} should have been {6,12}.)
data = {{1, 2}, {2, 4}, {3, 6}, {4, 8}, {5, 10}, {6, 12}, {7, 8}, {8, 6}, {9, 3}, {10, 2}};
BarChart[data[[All, 2]], ChartLabels -> data[[All, 1]]]
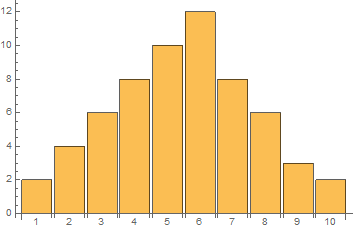
If the values 1 through 10 are not just discrete values but rather midpoints of the histogram bars (meaning the the underlying distribution is continous), then removing the spacing between bars would be more appropriate.
BarChart[data[[All, 2]], ChartLabels -> data[[All, 1]], BarSpacing -> None]