Dear All,
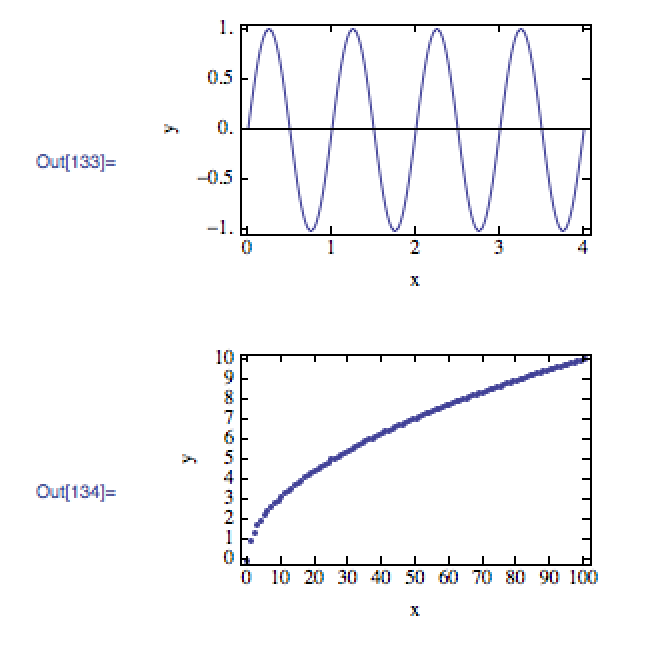
I'm trying to understand the inner workings of FrameTicks. Let's make 2 plots with 2% tick-length:
bot = {#, #, {0.02, 0}} & /@ Range[0, 4, 1];
top = {#, "", {0.02, 0}} & /@ Range[0, 4, 1];
left = {#, #, {0.02, 0}} & /@ Range[-1, 1, 0.5];
right = {#, "", {0.02, 0}} & /@ Range[-1, 1, 0.5];
fticks = {{left, right}, {bot, top}};
bot = {#, #, {0.02, 0}} & /@ Range[0, 100, 10];
top = {#, "", {0.02, 0}} & /@ Range[0, 100, 10];
left = {#, #, {0.02, 0}} & /@ Range[0, 10, 1];
right = {#, "", {0.02, 0}} & /@ Range[0, 10, 1];
fticks2 = {{left, right}, {bot, top}};
opts = Sequence[Frame -> True,
FrameStyle -> Directive[10, AbsoluteThickness[1]],
ImageSize -> {250, 150}, AspectRatio -> 0.6,
ImagePadding -> {{40, 5}, {40, 5}}, FrameLabel -> {"x", "y"}];
p1 = Plot[Sin[x 2 \[Pi]], {x, 0, 4}, FrameTicks -> fticks,
Evaluate@opts]
p2 = ListPlot[Table[{x, x^0.5}, {x, 0, 100, 1}],
FrameTicks -> fticks2, Evaluate@opts]

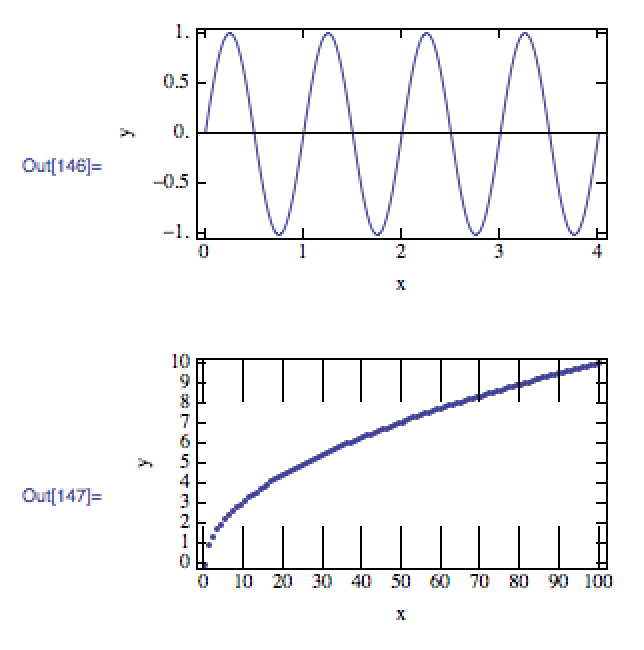
If I now change AspectRatio to Full (in order to fill out the image inside the inner box (imagesize - imagepadding)) it gives me this:

The problem becomes quite evident: once the AspectRatio is changed from 0.6 to Full the tick length also change: it looks like it chooses 2% (0.02) of the width (100), and project that back to the y axis (2 units in the y-axis is way more than 2%) . rather than using the height (10) and taking 2% of that. Is this as designed; it seems very unlogical to me.
Background: I'm trying to combine multiple plots using Inset and I need everything perfect alignment. So I specify and ImageSize with width and height specification for each plot, along with the same imagepadding settings. The idea is now that within that bounding-box and within those padding the plots all should fill this box. So rather than giving an aspect ratio I'd like to have them all 'full'. But this brings inconsistencies with the tick length (which I can artificially fix by introducing some multipliers, but it's a hassle!)
Regards,
Sander