Hello everyone. I was trying to understand the Bootstrap Analysis, so I found this example made in R: Make a difference: the alternative for p-values. Then, I try to replicate the analysis using the Mathematica method described here: How to | Perform a Bootstrap Analysis. But I was unable to replicate the R results, I would like to know if I am doing something wrong.
In the R post they used a data set, that you can find here: Material related to the blog "Quantification - rather than identification - of differences: An alternative for p-values". First they plot the data set, I did the same: 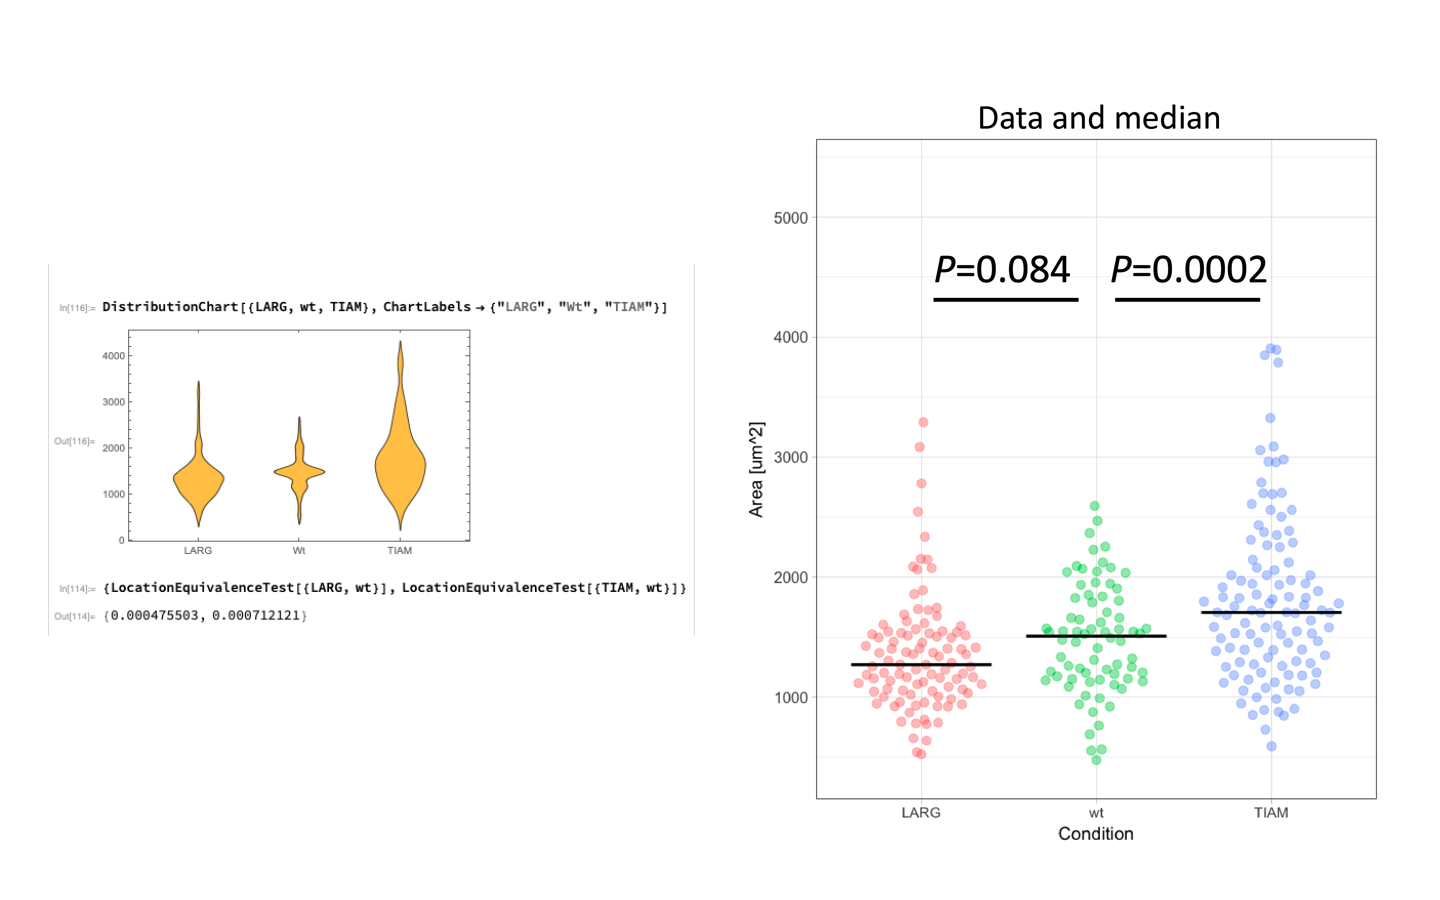 .
.
But when I create the Bootstrap, the distribution look completely different: 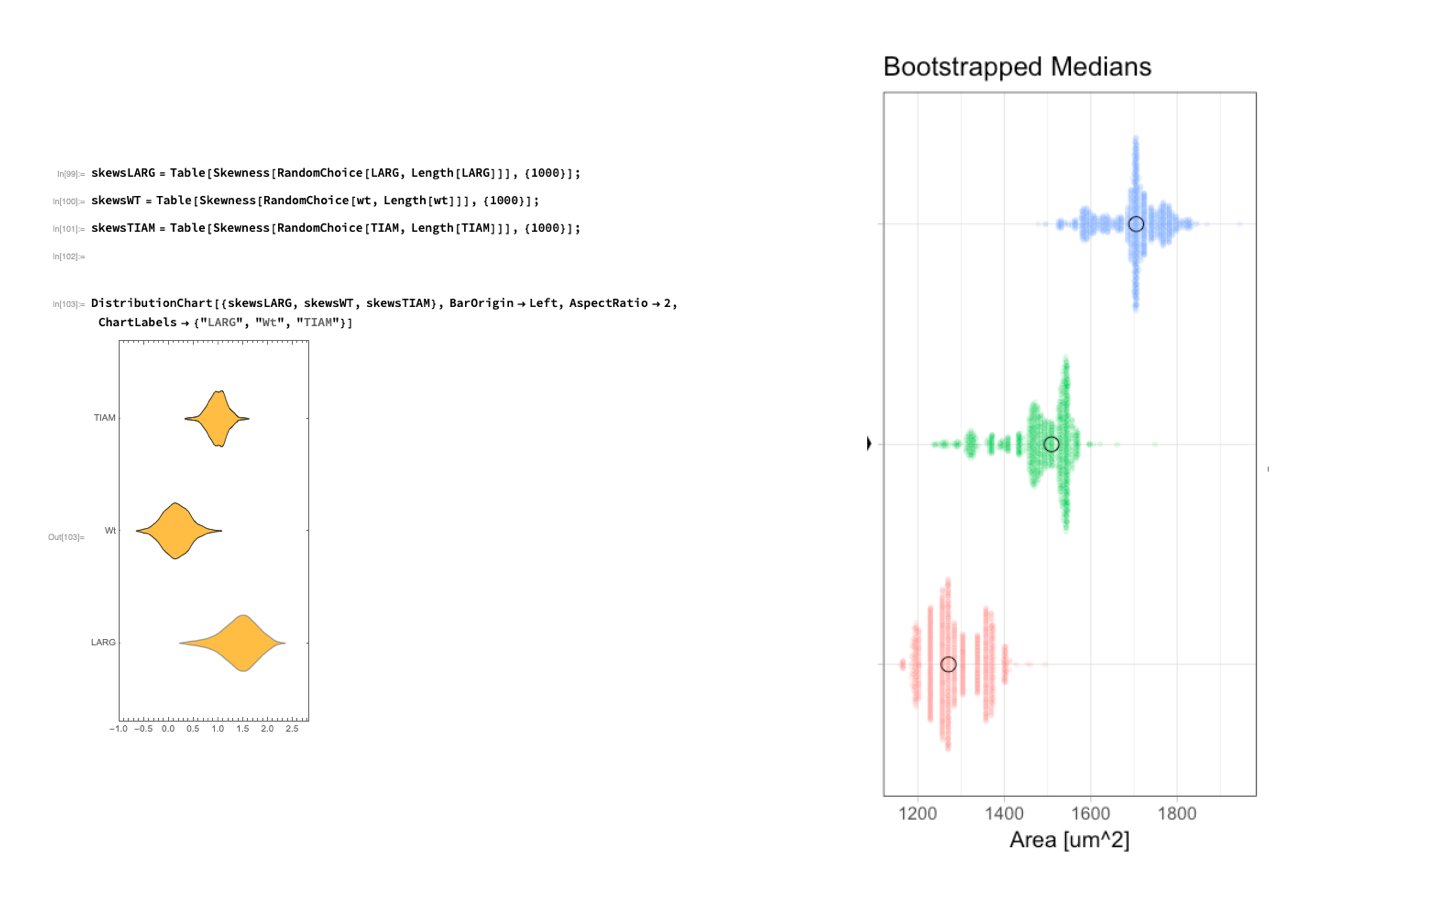 even when I did the subtraction:
 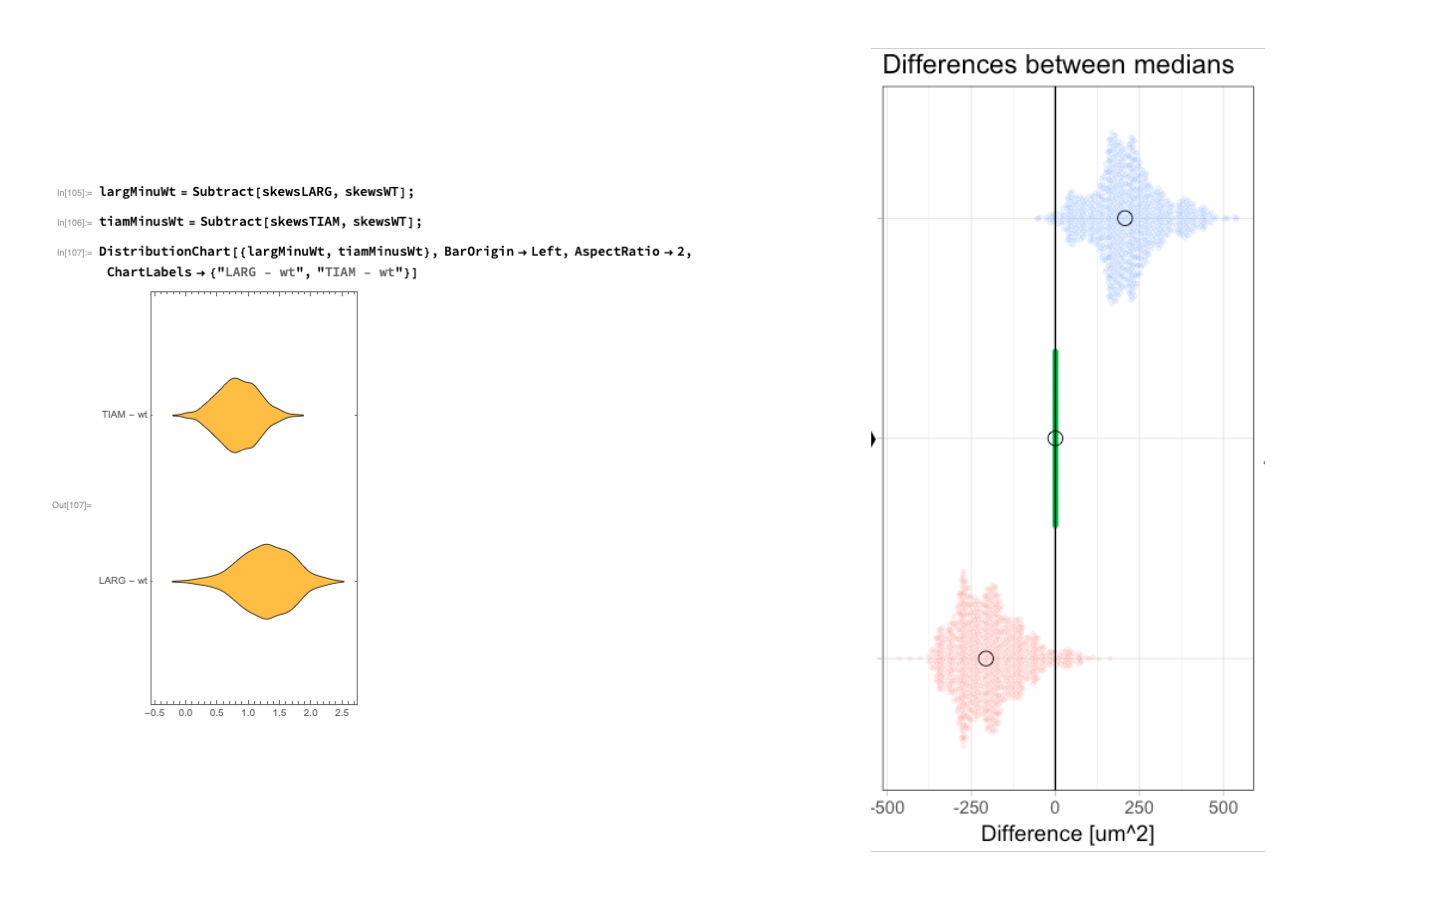 The analysis did not agree either. According to the post the confidence interval should be {27, 439}, but for the same condition I get {0.171788, 1.38594}. The other interval is {-350, 35}, but I get {0.335334, 1.95191}.
So I would like to know if I am doing something wrong in my analysis. Thank you very much.
I going to let the note book and the original data set
 Attachments:


