Here is a simple example. Given table of 3 rows and 4 columns, suppose you want to plot the second column against the 4th column.
Method 1tbl = { {1, 2, 3, 4},
{2, 5, 7, 8},
{9, 10, 11, 12}};
x = tbl[[All, 2]];
y = tbl[[All, 4]];
data = Transpose[{x, y}]
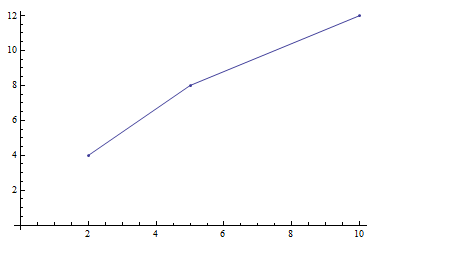
Now your data is
{{2, 4},
{5, 8},
{10, 12}}
Now you can plot it as
ListLinePlot[data, Mesh -> All, AxesOrigin -> {0, 0}]
 Method 2
You can select the columns and plot directly
tbl = {{1, 2, 3, 4}, {2, 5, 7, 8}, {9, 10, 11, 12}};
data = tbl[[ All, {2, 4} ]]
ListLinePlot[data, Mesh -> All, AxesOrigin -> {0, 0}]
bypassing headersNow if your table had header in it, you do not need to remove these. Simply start from the second row, instead of the first row, like this:
tbl = {{"h1", "h2", "h3", "h4"}, {1, 2, 3, 4},{2, 5, 7, 8},{9, 10, 11, 12}};
data = tbl[[ 2 ;;, {2, 4} ]]
ListLinePlot[data, Mesh -> All, AxesOrigin -> {0, 0}]


