This image will surely be familiar to many people on this forum:
CMT = RGBColor /@ Drop[Import["http://inversed.ru/Blog/Colormaps/New_Laguna.csv"], 4];

CM[x_] := Blend[CMT, x];

n = 8;
M = 2^n;
ArrayPlot[
    Table[BitXor[i, j], {i, 0, M - 1}, {j, 0, M - 1}],
    ColorFunction -> CM,
    PixelConstrained -> 4,
    Frame -> None
 ]
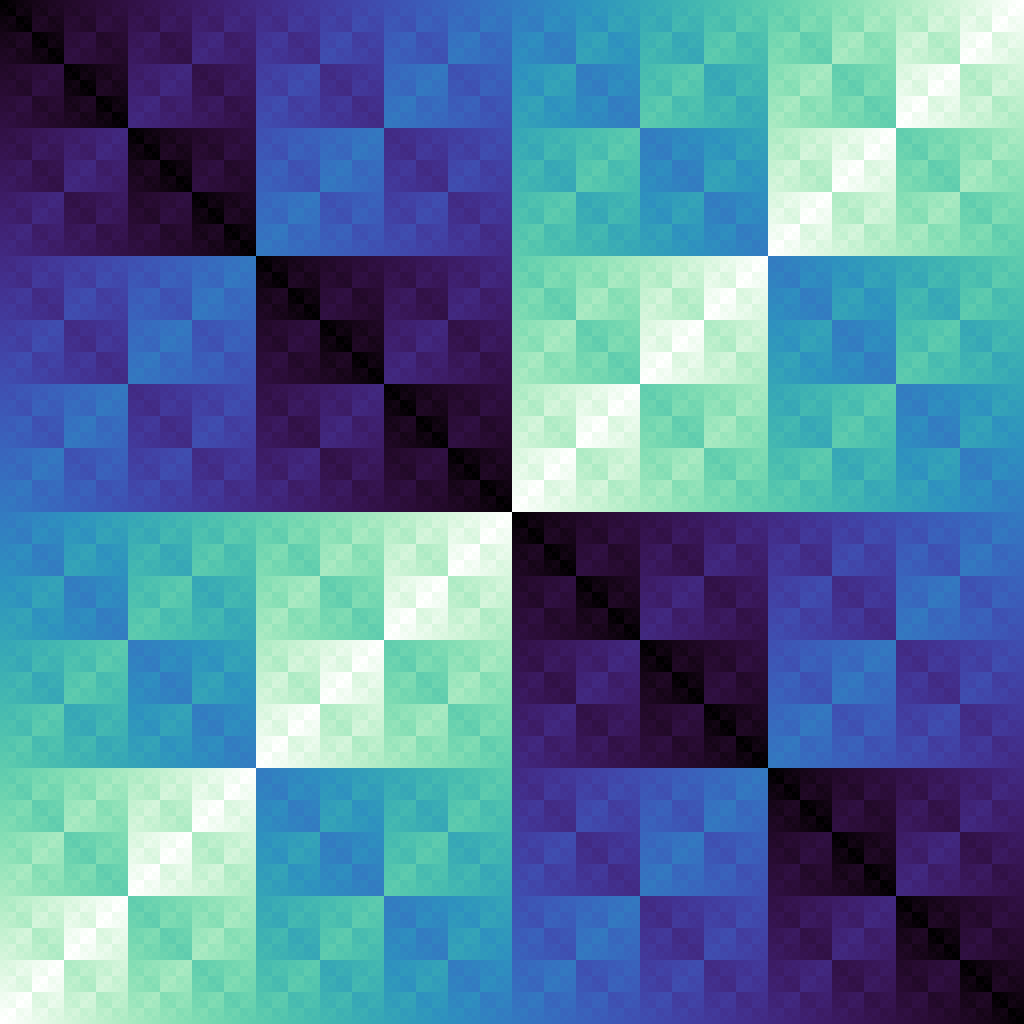
Its values are calculated by taking the bitwise xor of x and y coordinates, and its level sets (x xor y > t) form the famous munching squares animation discovered back in 1962: 
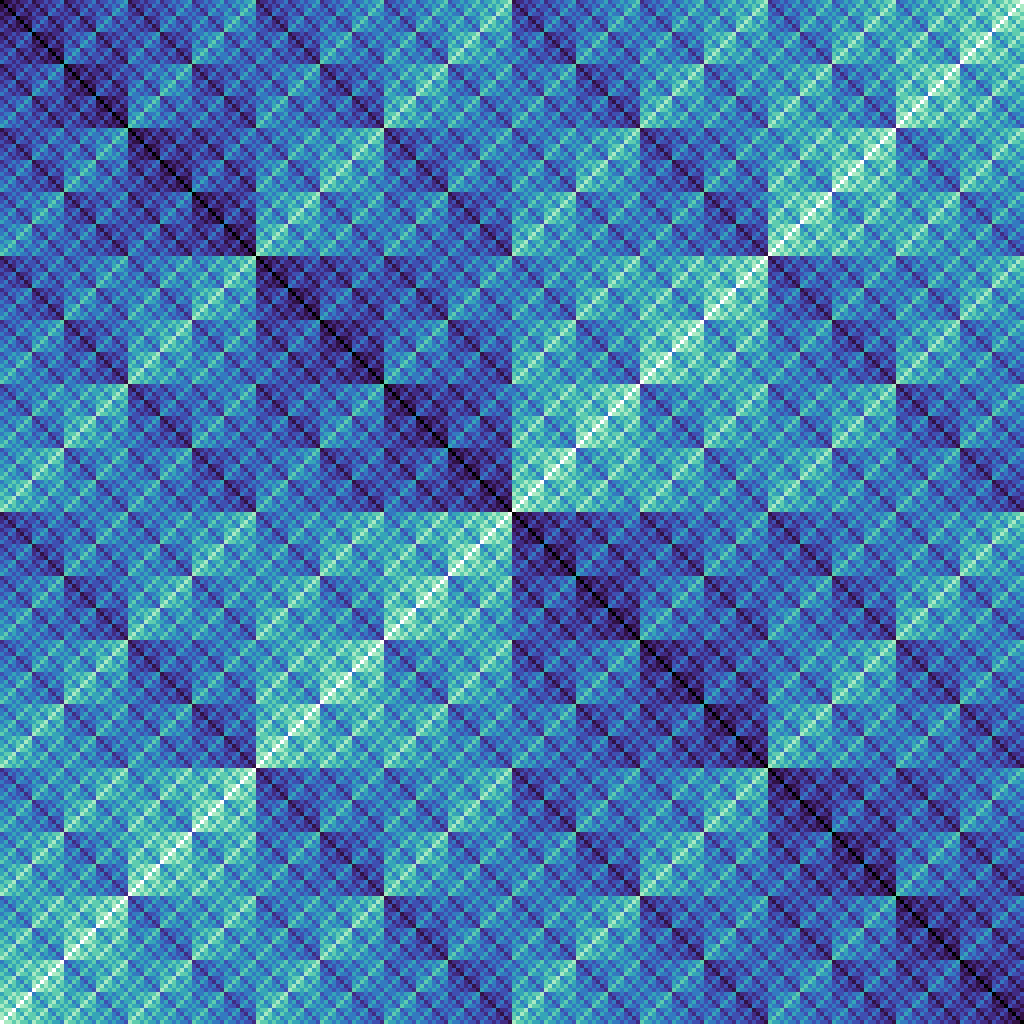
A more interesting image is obtained by plotting the bit counts of x xor y:
n = 8;
M = 2^n;
ArrayPlot[
    Table[
     Total[IntegerDigits[BitXor[i, j], 2, n]],
     {i, 0, M - 1}, {j, 0, M - 1}
    ],
    ColorFunction -> CM,
    PixelConstrained -> 4,
    Frame -> None
 ]
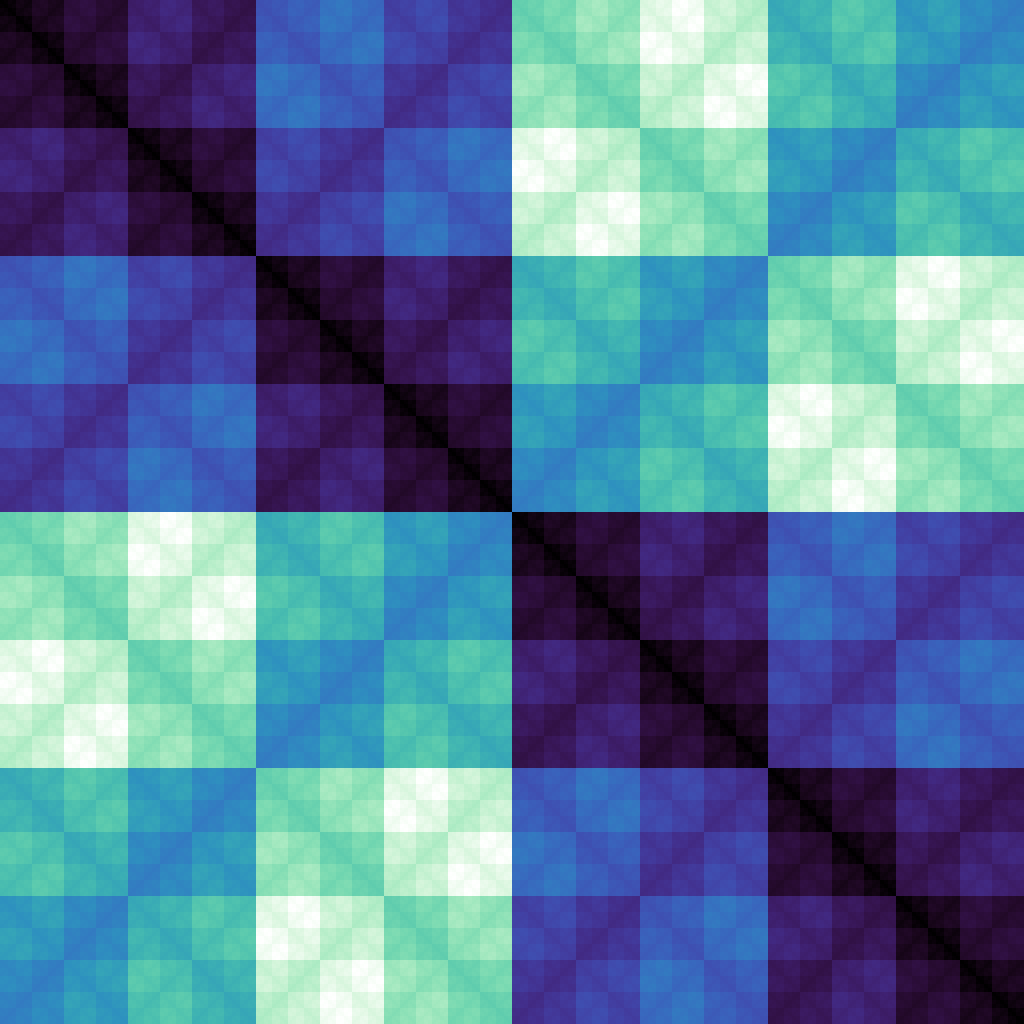
Let's see what happens if we convert the coordinates to Gray codes before the xor (BinToGray[x_] := BitXor[x, Quotient[x, 2]]). The function itself:
BinToGray[x_] := BitXor[x, Quotient[x, 2]];
GrayToBin[x_] := Module[
    {z = x, y = Quotient[x, 2]},
    While[y != 0,
           z = BitXor[z, y];
           y = Quotient[y, 2]
        ];
    z
   ];

n = 9;
M = 2^n;
ToDigits[x_] := IntegerDigits[BinToGray[x], 2, n];
ArrayPlot[
    Table[
     FromDigits[Mod[ToDigits[i] + ToDigits[j], 2], 2],
     {i, 0, M - 1}, {j, 0, M - 1}
    ],
    ColorFunction -> CM,
    PixelConstrained -> 2,
    Frame -> None
 ]
Modified munching squares:
n = 9;
M = 2^n;
ToDigits[x_] := IntegerDigits[BinToGray[x], 2, n];
A = Table[
   FromDigits[Mod[ToDigits[i] + ToDigits[j], 2], 2], {i, 0,
    M - 1}, {j, 0, M - 1}];
Draw[L_] := Rasterize[ArrayPlot[
        Table[Boole[
\!\(\*SubscriptBox[\(A\), \(\(\[LeftDoubleBracket]\)\(i,
        j\)\(\[RightDoubleBracket]\)\)]\) < L], {i, 1, M}, {j, 1,
      M}],
        ColorFunction -> GrayLevel,
        ColorFunctionScaling -> False,
        PixelConstrained -> 1,
        Frame -> None
    ]];
Draw[311]
NFrames = M + 1;
ExportFrame[i_] :=
    Export[
        "C:\\Temp\\" <> IntegerString[i, 10, 4] <> ".png",
        Draw[i]
    ];
ParallelMap[ExportFrame, Range[0, NFrames - 1]];

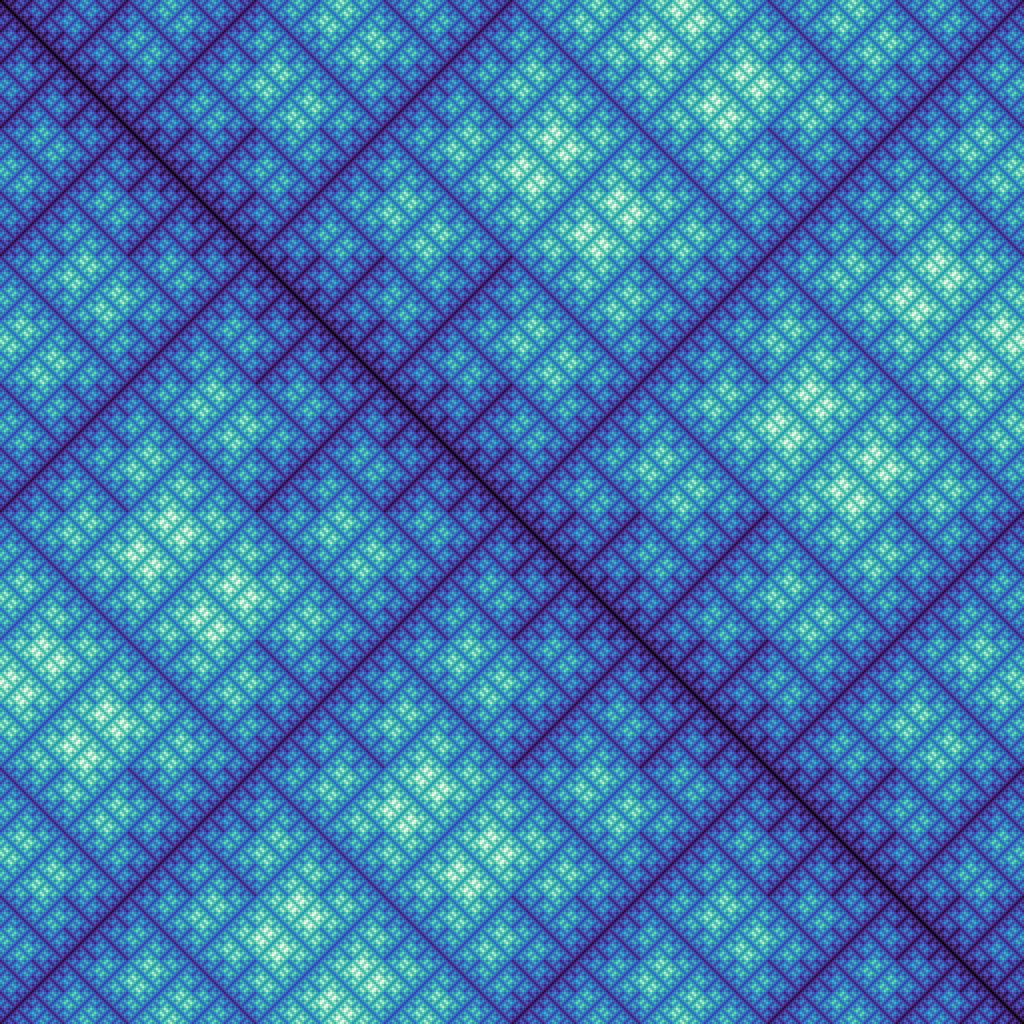
But bit count is the real beauty:
n = 9;
M = 2^n;
ToDigits[x_] := IntegerDigits[BinToGray[x], 2, n];
ArrayPlot[
    Table[
     Total[Mod[ToDigits[i] + ToDigits[j], 2]],
     {i, 0, M - 1}, {j, 0, M - 1}
    ],
    ColorFunction -> CM,
    PixelConstrained -> 2,
    Frame -> None
 ]
 Attachments:


