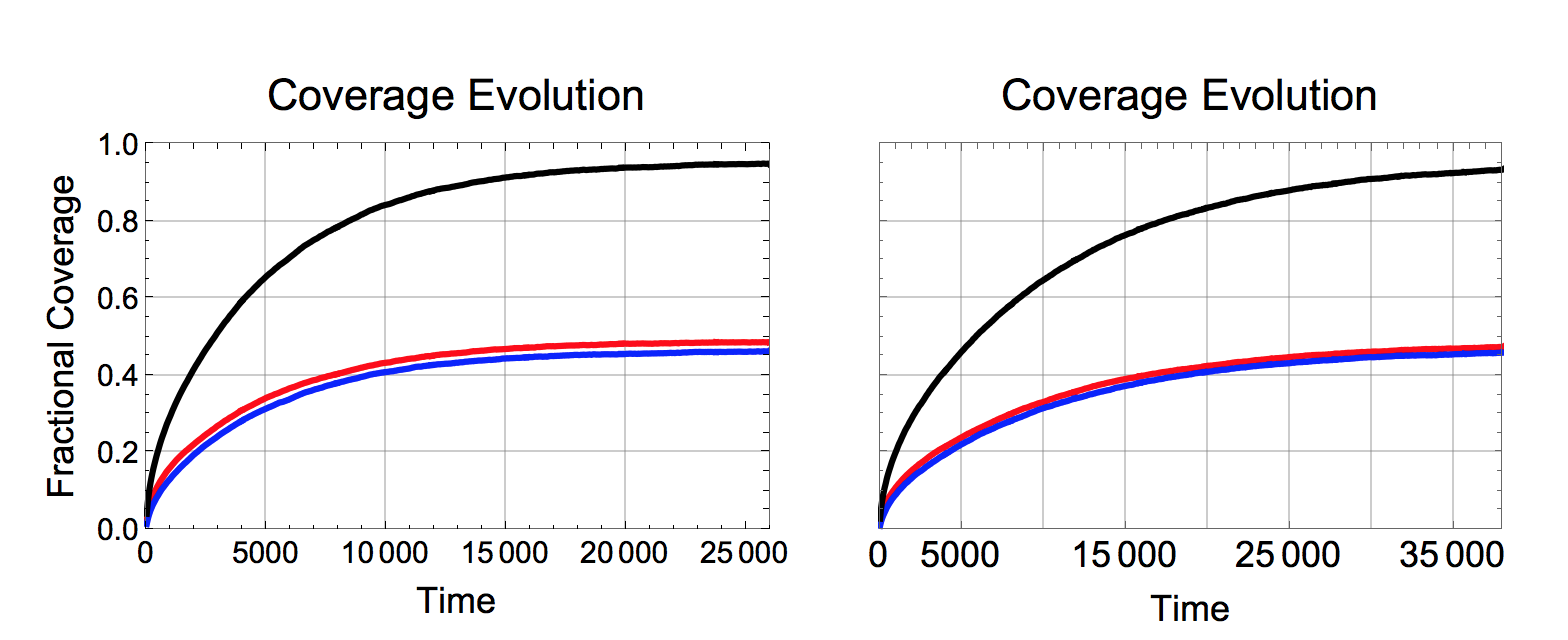
Hi all! I am looking to change the size of my axis labels to make them slightly larger. The issue I am running into is that when I set the axis labels font size, it also changes the tick marker number font size. I have a line setting the tick marker size to what I want, it seems to be overridden though. Also, I am not sure why but despite all having the same font sizes set for each figure, the frame tick numbers are different sizes between figures. Not really sure what is going on, any help is appreciated. Here is the relevant code.
padding = {{60, 60}, {60, 10}};

a1 = ListLinePlot[Thread[{#, {##2}}] & @@@ gkinA // Transpose,
   Frame -> True,
   FrameLabel -> {{"Fractional Coverage", None}, {"Time", None}},
   PlotLabel -> "Coverage Evolution",
   ImagePadding -> padding,
   PlotStyle -> {{Red, Thickness[0.01]}, {Blue,
      Thickness[0.01]}, {Black, Thickness[0.01]}},
   LabelStyle -> {FontFamily -> "Arial", FontSize -> 18, Black},
   GridLines -> Automatic,
   FrameTicksStyle -> Directive[Black, 15],
   PlotRange -> {{0, 26000}, {0, 1}},
   ImageSize -> {500, 500}];

b1 = ListLinePlot[Thread[{#, {##2}}] & @@@ gkinB // Transpose,
   Frame -> True,
   FrameLabel -> {{None, None}, {"Time", None}},
   PlotLabel -> "Coverage Evolution",
   ImagePadding -> padding,
   PlotStyle -> {{Red, Thickness[0.01]}, {Blue,
      Thickness[0.01]}, {Black, Thickness[0.01]}},
   LabelStyle -> {FontFamily -> "Arial", FontSize -> 18, Black},
   FrameTicksStyle -> {{Directive[FontOpacity -> 0, FontSize -> 0],
      Directive[FontOpacity -> 0, FontSize -> 0]}, {Automatic,
      Directive[FontOpacity -> 0, FontSize -> 0]}},
   FrameTicksStyle -> Directive[Black, 15],
   PlotRange -> {{0, 38000}, {0, 1}},
   GridLines -> Automatic,
   FrameTicks -> {{Automatic,
      Automatic}, {{0, 5000, 15000, 25000, 35000}, Automatic}},
   ImageSize -> {500, 500}];

GraphicsGrid[{{a1, b1}, {a2, b2}, {a3, b3}}, Spacings -> {-75, -170}]
 Attachments:


