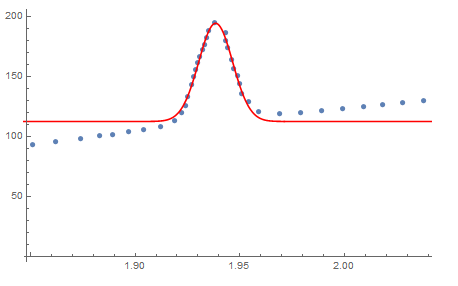
Adjustment:
 data = Import["a.csv", "table", FieldSeparators -> " "];
 nlm = NonlinearModelFit[data,
    d + a*Exp[-(x - b)^2/2 c^2], {{a, 100}, {b, 1.94}, {c, 90}, {d,
      95}}, x];
 nlm["AdjustedRSquared"];
 nlm[x];
 nlm["ParameterTable"];
 dataplot = ListPlot[data];
 fitplot =
   Plot[nlm[x], {x, 1.8, 2.10}, PlotStyle -> Red, PlotRange -> All];
 Show[dataplot, fitplot]
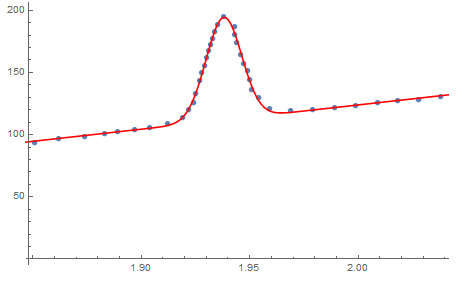
A better model:
 data = Import["a.csv", "table", FieldSeparators -> " "];
 nlm = NonlinearModelFit[data,
    d + a*Exp[-(x - b)^2/2 c^2] +
     e*x, {{a, 100}, {b, 1.94}, {c, 90}, {d, 95}, {e, 200}}, x];
 nlm["AdjustedRSquared"];
 nlm[x];
 nlm["ParameterTable"];
 dataplot = ListPlot[data];
 fitplot =
   Plot[nlm[x], {x, 1.8, 2.10}, PlotStyle -> Red, PlotRange -> All];
 Show[dataplot, fitplot]