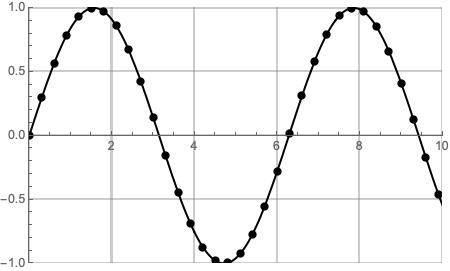
How to draw a graph as shown for the function y = Sin [x]? I have difficulties and hope everyone will help me.
Almost identical:
Plot[Sin[x], {x, 0, 10}, Mesh -> 30, PlotStyle -> Black,
 MeshStyle -> Directive[PointSize[Large], Black],
 GridLines -> Automatic, Frame -> True, Axes -> {False, True}]
Regards MI.
Show[
 Plot[Sin[x], {x, 0, 10}, GridLines -> Automatic, PlotRange -> {{0, 10}, {-1, 1}}, PlotStyle -> Black],
 ListPlot[Table[{x, Sin[x]}, {x, 0, 10, .3}], PlotStyle -> {PointSize[.02], Black}]
]
I can't plot it with line style as showed
What have you tried thus far?