Group Abstract Group Abstract

Message Boards Message Boards

0
|
12.1K Views
|
5 Replies
|
1 Total Like
View groups...
Share
Share this post:

Plot results of Fermat factorization method with ContourPlot?

For the following set of commands the Contour Plot does not appear to display:

h = Cos[(2 \[Pi] ((x)^2 + (y)^2)/(2*5*w))]^2

h1
u1 = ContourPlot[h1 == 1, {x, -15, +15}, {y, -15, +15}, 
   GridLines -> Automatic];
u2 = Graphics[{Red, Point[{7, 11}]}];
s4 = Show[{u1, u2}]

Plot3D[h1, {x, -15, +15}, {y, -15, +15}]

The complete NoteBook is attached. You insights are welcome.

I'm using Version 11.3

Regards, Edward

Attachments:
POSTED BY: Edward Newsome
5 Replies

It looks very cool.

Sure. Just for the logs, ContourPlot[] must not be used where it does not fit

Clear[h, h1, h1r]
h[x_, y_, w_] := Cos[2 \[Pi] (x^2 + y^2)/(2 5 w)]^2
h1[x_, y_] := h[x, y, 17.]
h1r[r_] := Cos[2 \[Pi] r^2/170.]^2

combine three different 2D graphics into one plot

Show[{ContourPlot[h1[x, y], {x, -15, 15}, {y, -15, 15},
   Contours -> 10, 
   ColorFunction -> "Pastel",
   PlotLegends -> Automatic,
   DisplayFunction -> Identity],
  ParametricPlot[(# {Cos[\[Phi]], Sin[\[Phi]]}) & /@ 
    Sqrt[85. Range[5]], {\[Phi], 0, 2 \[Pi]},
   PlotStyle -> {Black, Dashed},
   DisplayFunction -> Identity], 
  Graphics[{Black, Point[{0, 0}],
    DisplayFunction -> Identity}]},
 DisplayFunction -> $DisplayFunction]

as
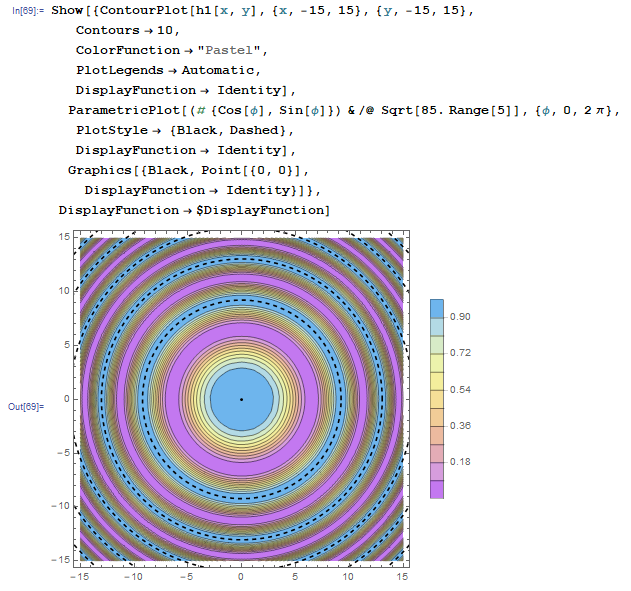
enter image description here

POSTED BY: Dent de Lion

Thanks for the recommendations. First, as pointed out by Dent de Lion:

(1) Contours for functions f(x,y) = 0 where f(x,y) >= 0 are always poorly detected

Second, I needed to develop a better understanding of the "ContourPlot" function.

Lastly, to show you the final form of my script or program, I have attached the Notebook with the correct utilization of the "ContourPlot" function. The graphic output meets my visualization objectives.

I like it. It looks very cool. Again, thanks for the recommendations.

Attachments:
POSTED BY: Edward Newsome
POSTED BY: Dent de Lion

Cool, Udo.

I think this is nice as well

Show[Plot3D[h1[x, y], {x, -15, 15}, {y, -15, 15}, PlotPoints -> {31, 39}], 
 Plot3D[.95, {x, -15, 15}, {y, -15, 15}, PlotStyle -> Opacity[.8]]]

and your statement slightly modified

ContourPlot[h1[x, y] == .95, {x, -15, 15}, {y, -15, 15},  GridLines -> Automatic]
POSTED BY: Hans Dolhaine
Posted 7 years ago

Your commands above do not seem to hang together as a complete set. You define h, which is not then used (did you mean h1?).

In the next line, you have h1 u1 = ...

Are h1 and u1 supposed to be multiplied together? If so, why are you then assigning to them (with a single = sign) as though they were a variable? What does this mean?

You seem to be using h1 as a function, taking parameters x and y. But in that case, should you not define it by, say

h1[x_, y_] := Cos[(2[Pi] ((x)^2 + (y)^2)/(25 w))]^2

From what I can tell, you seem to have a number of confusions. I suggest you look at some examples of ContourPlot and gradually adapt them towards what you want.

POSTED BY: Marc Widdowson
Reply to this discussion
Community posts can be styled and formatted using the Markdown syntax.
Reply Preview
Attachments
Remove
or Discard