Message Boards Message Boards

[?] Plot data imported in TSV format?

Posted 5 years ago

I currently have data in this format of an x value and 5 sets of y values that I am importing into mathematica as data sets. I have been trying to find a way to graph data imported to mathematica in this format, but I haven't found any success. The data is in CSV format in a .dat file. Thank you!

Example photo of data format

POSTED BY: Aaron Fultineer
2 Replies
Posted 5 years ago

After you have imported the data as suggested by Neil, it should be in the form of a list of lists. e.g.

data = {
  {0.15, -4.0, -2.5, -6.5, -2.0, -8.5},
  {0.25, -4.0, -2.5, -6.5, -2.0, -8.5},
  {0.35, -4.0, -2.5, -6.5, -2.0, -8.5},
  {0.45, -4.0, -2.5, -6.5, -2.0, -8.5}
  }

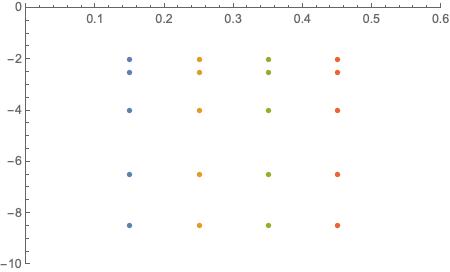
One way to plot it is using ListPlot with the x value paired with each of the y values.

plotData = Tuples[{{First[#]}, Rest[#]}] & /@ data

 (* {{{0.15, -4.}, {0.15, -2.5}, {0.15, -6.5}, {0.15, -2.}, {0.15, -8.5}},
     {{0.25, -4.}, {0.25, -2.5}, {0.25, -6.5}, {0.25, -2.}, {0.25, -8.5}},
     {{0.35, -4.}, {0.35, -2.5}, {0.35, -6.5}, {0.35, -2.}, {0.35, -8.5}},
     {{0.45, -4.}, {0.45, -2.5}, {0.45, -6.5}, {0.45, -2.}, {0.45, -8.5}}} *)

Then

ListPlot[plotData, PlotRange -> {{0, .6}, {0, -10}}]

enter image description here

POSTED BY: Rohit Namjoshi

Aaron,

I believe your format is TSV (assuming the spaces are created by tabs) and not CSV (since you have no commas). See the guide on Import TSV here. If you truly have spaces separating your variables you can use SemanticImport[] (here) or use ReadList[].

Regards,

Neil

POSTED BY: Neil Singer
Reply to this discussion
Community posts can be styled and formatted using the Markdown syntax.
Reply Preview
Attachments
Remove
or Discard

Group Abstract Group Abstract