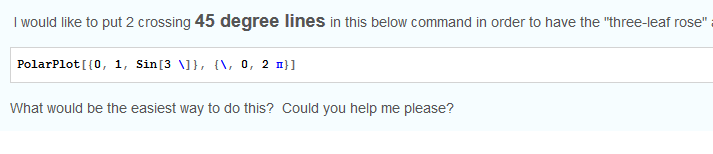
Can't read your code. This how it shows up on my screen (firefox)
But you can always add lines using Epilog, or combine plots using Show and many other ways. Assuming your "\" is say "x",
you can do
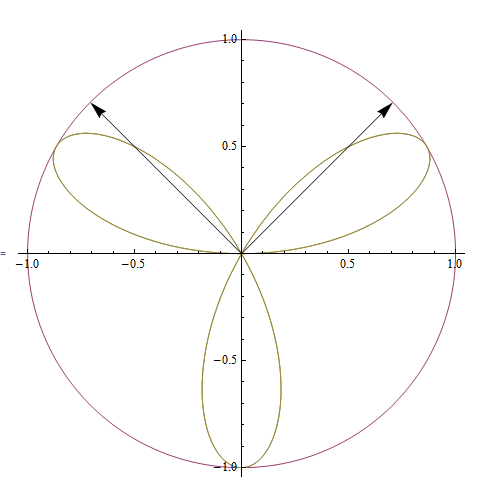
z = 45 Degree;
PolarPlot[{0, 1, Sin[3 x]}, {x, 0, 2 \[Pi]},Epilog -> {Arrow[{{0, 0}, {Cos[z], Sin[z]}}], Arrow[{{0, 0}, {-Cos[z], Sin[z]}}]}]