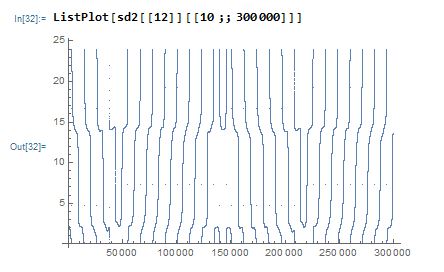
If the y-axis in the image corresponds to MLT, and we are looking at a number of orbits. How do you interpret the way the lines are with respect to an orbit?
If I zoom in closer:
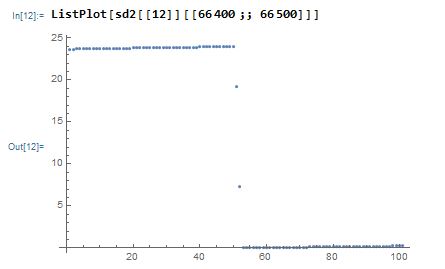
My loop double counts the number of orbits because of this issue.
I need to be able to cut it off as appropriate and there is alot of data.
orbitStarts = {};
orbitEnds = {};
inOrbit = False;
sd2T = Transpose[sd2];
For[i = 1, i <= Length[sd2[[1]]], i++,
  sdtemp = sd2T[[i]];
  If[sdtemp[[2]] >= 40 &&
    sdtemp[[2]] <= 80 && (sdtemp[[3]] >= 18 || sdtemp[[3]] <= 6),
   If[inOrbit, Continue,
     inOrbit = True;
     AppendTo[orbitStarts, i];];
   , If[inOrbit, inOrbit = False; AppendTo[orbitEnds, i];, Continue]];

  ];
If[inOrbit, inOrbit = False; AppendTo[orbitEnds, i];];
The condition in the loop filters for lat 40<x<80 and nightside MLT 18 hr < x < 6 hr.
One could use a median on the filter, to check the last 10 data points before actually ending an orbit. Is this the best approach?
What do you recommend?


