Hello everyone. I have three vectors of data, the first one is the propper information, the other ones are the error in both X and Y axis. I want to plot them as in this example: https://reference.wolfram.com/language/ErrorBarPlots/ref/ErrorBar.html; however, the information here has been introduced manually. Is there a way to program this to be read from three vectors for the error on both axis plus the obtained values?
I have tried with this, but it does not work:
g1 = ErrorListPlot[{meanx1, meanx2}, ErrorBar[stdx1, stdx2]]
Aditionally I adjoint an image of an attempt I have made to plot this data in case it can help.
Thanks for reading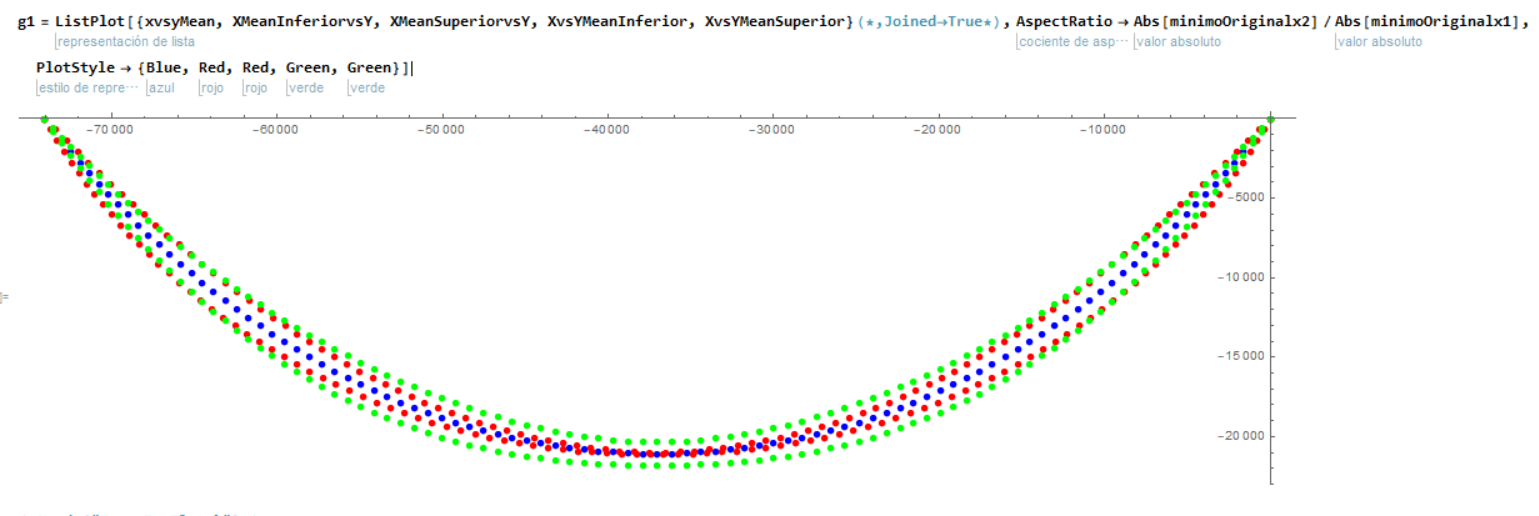 .
.


