Pardon the newbie-type question, but I'm struggling with the Mathematica syntax for a bell curve. All I want to draw is a bell curve with mean 3 and SD of 0.3, but with the region between the graph, the x-axis, -2sigma and +1 sigma shaded (where sigma = standard deviation). Can someone help?
TIA
Geoffrey
Thank you very much Rohit. Geoffrey
Geoffrey,
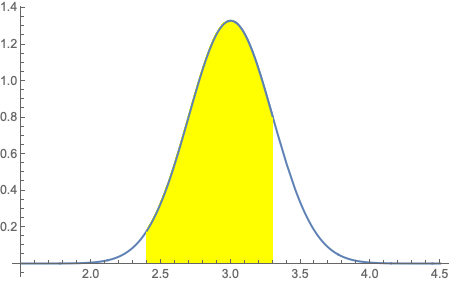
One way to do this is to combine two plots.
p1 = Plot[PDF[NormalDistribution[3, 0.3], x], {x, 1.5, 4.5}];
p2 = Plot[PDF[NormalDistribution[3, 0.3], x], {x, 2.4, 3.3}, Filling -> 0, FillingStyle -> Yellow];

Show[{p1, p2}]