Message Boards Message Boards

Rescale data points that are representing corners of hexagons?

Posted 5 years ago

Hello Forum, I hope this is the right place that I am posting this question. If not please feel free to comment so that I find the right place. I have 4 sets of points that represent points on hexagons. My data points are such that when I plot them , hexagons are next to each other, but I want to plot each hexagon on top of each other (stack them on top of each other) , So that I compare them and do further analysis.

Image 1 shows the data points

enter image description here

Image 2 shows the resulting plots

enter image description here

But this is not what I want, I want all points to be rescaled such that they are on top of each other something like following image :

enter image description here

This is just an example, I made a perfect hexagon and some points which are deviated from each corner so it's easy to visualize what I want. What is the best way to re-scale data points for each hexagon, mathematically? I believe there must be a way to scale all data point to a reference data set (for instance a perfect hexagon).

I was thinking to normalize my points using feature scaling formula (x'=X-Xmin/Xmax-Xmin), but it will only change the scale of the coordinates and the hexagons will still be next to each other. Also I was thinking to find equation of lines and plot the lines and lengths. I feel like there is a way by defining a fixed hexagon and find deviation of each point of my data from that fixed hexagon, or maybe there is some other formula. What do you suggest?

Thank you in advance,

copy of data points are attached,

POSTED BY: Armitos Moto
2 Replies

Well, I am now just assuming that your question is meant to be answered in terms of WL. If not - than this might serve as a strong motivation to buy a license for this ingenious piece of software! I start by importing and organizing you .csv data:

data0 = Import["<your datapath>/datapoints_hexagons.csv", "Data"];
pts = Map[Reverse, Transpose[Partition[#, 2] & /@ data0[[2 ;; -2, 2 ;;]]], {2}];
hex = Polygon /@ pts;
style = {#, EdgeForm[#]} & /@ {Red, Green, Blue, Gray};
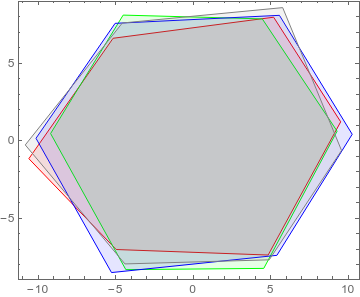
Graphics[Flatten@{Opacity[.1], Riffle[style, hex]}, Frame -> True]

This gives:

enter image description here

Now the simple idea is to do a translation according to the center of every hexagon:

centers = RegionCentroid /@ hex;
subtract[pts_, pt_] := # - pt & /@ pts
newPoints = MapThread[subtract, {pts, centers}];
newHex = Polygon /@ newPoints;
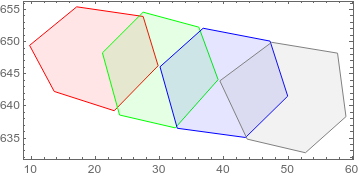
Graphics[Flatten@{Opacity[.1], Riffle[style, newHex]}, Frame -> True]

which results in:

enter image description here

EDIT:

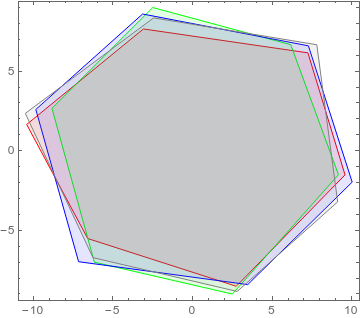
As a bonus: One can try a rotation correction like so:

getRotation[pts_List] := Module[{\[Phi]},
   \[Phi] = Mod[(VectorAngle[{1, 0}, #] & /@ pts), Pi/6];
   NArgMin[EuclideanDistance[\[Phi], ConstantArray[\[FormalA], 6]], \[FormalA]]
   ];

rot = getRotation /@ newPoints;

Graphics[Flatten@{Opacity[.1], Riffle[style, Thread[Rotate[newHex, rot]]]}, Frame -> True]

enter image description here

POSTED BY: Henrik Schachner

Welcome to Wolfram Community! This forum permits only subjects related to Wolfram Technologies. Post elsewhere for other subjects (including general science & technology) or EDIT your post and make clear the connection to Wolfram Technologies by sharing your Wolfram Language code. Please read the rules: http://wolfr.am/READ-1ST

POSTED BY: Moderation Team
Reply to this discussion
Community posts can be styled and formatted using the Markdown syntax.
Reply Preview
Attachments
Remove
or Discard

Group Abstract Group Abstract