Dear all,
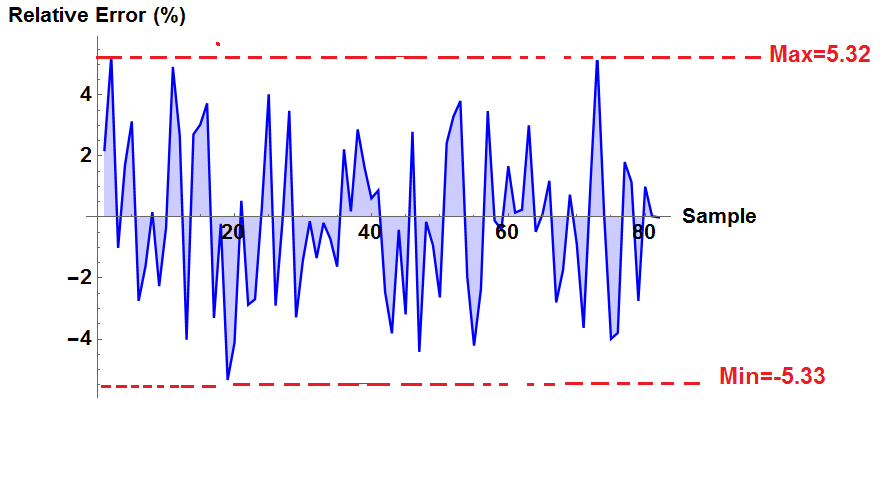
How do I plot two parallel lines for maximum and minimum values of relative error percentage as below:
In[124]:= m = {2.2027036725996783`,
  5.280362701954329`, -1.0124449729925813`, 1.698979465419002`,
  3.141591718306451`, -2.745060440009399`, -1.6113207086717107`,
  0.16638391106163822`, -2.258695482994957`, -0.3482598627250328`,
  4.925577851518227`, 2.6750207005122877`, -4.02288009868453`,
  2.714952029120464`, 3.034760679525427`,
  3.729591243576016`, -3.3014545762020924`, -0.22188437300968553`, \
-5.337065768483884`, -4.1220754806842725`,
  0.5332742419880744`, -2.8743222182737225`, -2.693012697508946`,
  0.32865798833744514`,
  4.027192028466991`, -2.8987838601887117`, -0.16628212916201005`,
  3.484024392679025`, -3.2865991892298494`, -1.4074929511476675`, \
-0.1376591620771673`, -1.340169784223353`, -0.18874557070863454`, \
-0.7158258869527857`, -1.6221568977272842`, 2.220428106758959`,
  0.18756079584372606`, 2.877020526594872`, 1.6279535082847358`,
  0.615660929310434`,
  0.8731989288504256`, -2.4430509995815504`, -3.8101555754900276`, \
-0.41354676208662355`, -3.1882480501258503`,
  2.797772540468918`, -4.423074431837073`, -0.15315482194415617`, \
-0.9330704276794881`, -2.6279243117503595`, 2.4286072216474692`,
  3.303587280307156`,
  3.8085267078688805`, -1.9518727734300068`, -4.213412770426206`, \
-2.357017551327045`,
  3.4733691167400265`, -0.11673331538713343`, -0.40688016301067764`,
  1.6698198640343067`, 0.14831028096303508`, 0.24317430279547272`,
  3.011211821071481`, -0.48218554546387205`, 0.09689880402434317`,
  1.191374402522961`, -2.7963094788933693`, -1.7336554568628828`,
  0.7339703452354714`, -0.8739780822047689`, -3.63379798637767`,
  1.0591084727706641`, 5.324198415974884`,
  0.0845454122567755`, -3.991208337015724`, -3.793925049867107`,
  1.8074800549551044`, 1.1480036635543738`, -2.7476419011691475`,
  1.00023361017206`, 0.028334302480905814`, -0.008048998604257977`}

In[129]:= {Max[m], Min[m]}

Out[129]= {5.3242, -5.33707}

In[130]:= ListLinePlot[m, LabelStyle -> {14, GrayLevel[0], Bold},
 ImageSize -> 500, PlotStyle -> Blue,
 AxesLabel -> {"Sample", "Relative Error (%)"}, Filling -> Axis,
 PlotRange -> All]
Many thank!


