Message Boards Message Boards

0
|
3751 Views
|
2 Replies
|
1 Total Likes
View groups...
Share
Share this post:
GROUPS:

How to plot Vogels model in Mathametica

Posted 5 years ago

The formula for Vogels model is: enter image description here

And it should give a graph like this: enter image description here

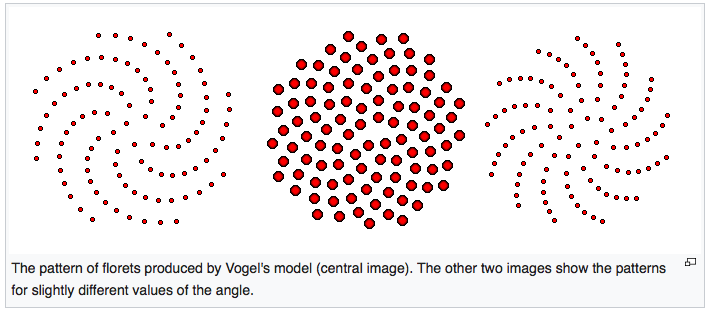
But I'm getting just a spiral in mathametica: enter image description here

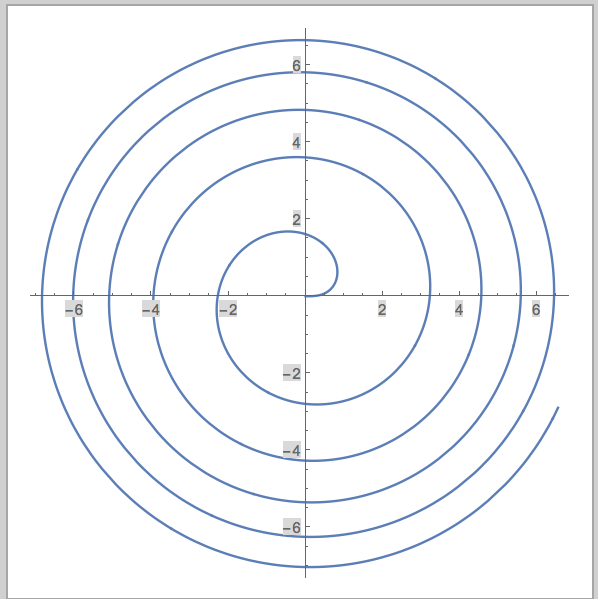
My code looks like this: Manipulate[ PolarPlot[2 Sqrt[t/2.417281], {t, 0, s}, PlotRange -> Automatic], {s, 1, 100, 1}]

Any idea how I can make the code output a spiral like how it should be in Vogels model?

POSTED BY: amna haq
2 Replies
Posted 5 years ago
ListPlot[Table[
  With[{c = 1., \[Phi]0 = 137.508 Degree}, 
   c Sqrt[n] {Cos[n \[Phi]0], Sin[n \[Phi]0]}], {n, 1, 80}], 
 PlotRange -> All, AspectRatio -> 1, Axes -> False]
POSTED BY: Michael Helmle
Posted 5 years ago

This works perfectly! Thank you!

POSTED BY: amna haq
Reply to this discussion
Community posts can be styled and formatted using the Markdown syntax.
Reply Preview
Attachments
Remove
or Discard

Group Abstract Group Abstract