It looks useful, but . . . .
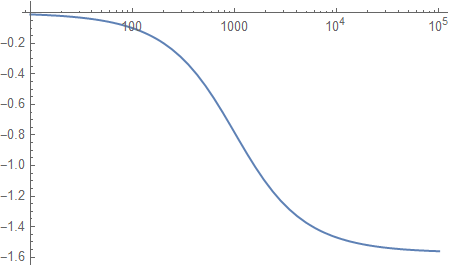
Plot the Arg of a complex expression:
tf = 1000/(s + 1000);
Plot[Arg[tf /. s -> w I], {w, 10, 100000}, PlotRange -> All,
 ScalingFunctions -> {"Log", "Linear"}]
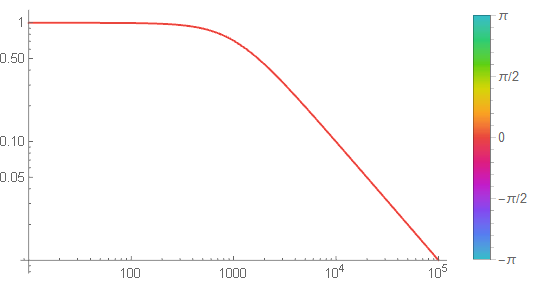
We can get a Log plot:
AbsArgPlot[tf /. s -> w I, {w, 10, 100000}, PlotRange -> All,
 ScalingFunctions -> "Log", PlotLegends -> Automatic]
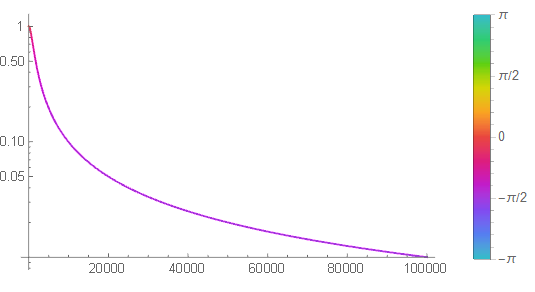
But a LogLog plot breaks the color function for Arg:
AbsArgPlot[tf /. s -> w I, {w, 10, 100000}, PlotRange -> All,
 ScalingFunctions -> {"Log", "Log"}, PlotLegends -> Automatic]