Message Boards Message Boards

0
|
5443 Views
|
2 Replies
|
2 Total Likes
View groups...
Share
Share this post:

I want to replicate the right graph of this page :(

Posted 5 years ago

enter image description here

I don't know how to express the function, and I doubt that it is a function because... when x=40, the y value seems to have two values... right?

Any ideas plz :(

POSTED BY: Jihun Park
2 Replies

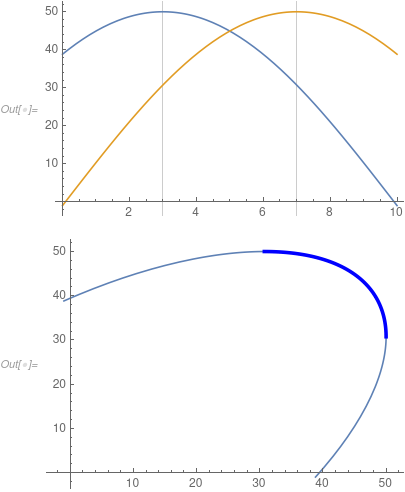
You probably need ParametricPlot:

functs = 50 {Cos[(x - 3)/4.4], Cos[(x - 7)/4.4]};
Plot[functs, {x, 0, 10}, GridLines -> {{3, 7}, None}]
Show[ParametricPlot[Evaluate@functs, {x, 0, 10}], 
 ParametricPlot[Evaluate@functs, {x, 3, 7}, 
  PlotStyle -> {Blue, Thickness[.01]}]]

enter image description here

POSTED BY: Henrik Schachner
Posted 5 years ago

Thank you so much! ;) I should study about the function~!

POSTED BY: Jihun Park
Reply to this discussion
Community posts can be styled and formatted using the Markdown syntax.
Reply Preview
Attachments
Remove
or Discard

Group Abstract Group Abstract