Message Boards Message Boards

1
|
3964 Views
|
3 Replies
|
1 Total Likes
View groups...
Share
Share this post:

[?] Avoid curly brackets and numbering in LabelingFunction?

Posted 5 years ago

Hello,

Please can you help !

Why are the data in 'LabelingFunction' between curly brackets and numbered from 1 to 12 ? Should be without the curly brackets and without the numbering 1...12 (only with data 424,423....451).

data = {424, 423, 447, 438, 434, 451, 437, 434, 469, 450, 459, 451};

ListPlot[Tooltip [data]
 , BaseStyle -> PointSize[.02]
 , ImageSize -> 500
 , Filling -> Axis
 , FillingStyle -> Directive[Green, Thickness[.001]]
 , LabelStyle -> {10, GrayLevel[0], Bold}
 , LabelingFunction -> (Placed[#1, Above] &)
 , PlotStyle -> Red
 , PlotRange -> All
 ]
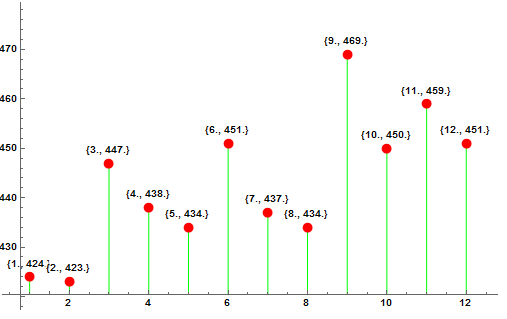
enter image description here

Regards ans thanks for your help....Jos

POSTED BY: Jos Klaps
3 Replies

Hi Sander,

Thanks for your quick reply and support. Yes, this is what I expected !

Thanks again,....Jos

POSTED BY: Jos Klaps

Can be solved by:

Placed[#1[[2]], Above] &

Not sure if this is as expected thoughÂ…

POSTED BY: Sander Huisman

... well, if one executes the "Basic Examples" in the documentation on LabelingFunction then a more general change its the behaviour can be seen. So - no, I do not think that this is expected.

POSTED BY: Henrik Schachner
Reply to this discussion
Community posts can be styled and formatted using the Markdown syntax.
Reply Preview
Attachments
Remove
or Discard

Group Abstract Group Abstract