Hi,
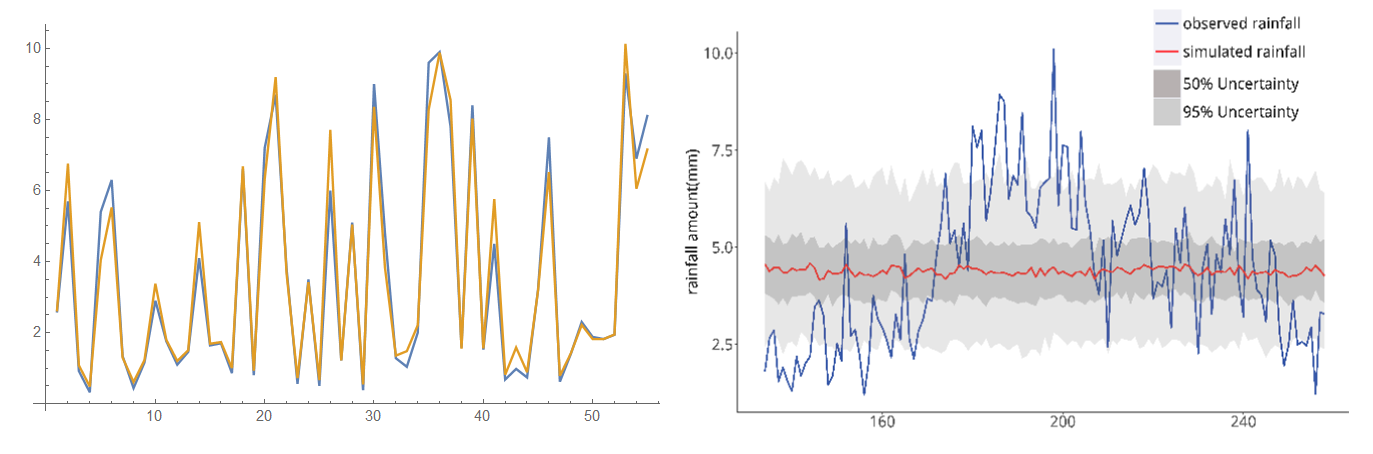
How do I plot interval bands for 50% and 95 % for the observed and simulated data?. Many thank for your help.
Observed = {2.6`, 5.7`, 0.92`, 0.32`, 5.4`, 6.3`, 1.34`, 0.44`, 1.16`,
    2.9`, 1.76`, 1.1`, 1.46`, 4.1`, 1.64`, 1.7`, 0.86`, 6.6`, 0.8`,
   7.2`, 8.7`, 3.8`, 0.56`, 3.5`, 0.5`, 6.`, 1.22`, 5.1`, 0.38`, 9.`,
   4.8`, 1.28`, 1.04`, 2.`, 9.6`, 9.9`, 7.8`, 1.58`, 8.4`, 1.52`,
   4.5`, 0.68`, 0.98`, 0.74`, 3.2`, 7.5`, 0.62`, 1.4`, 2.3`, 1.88`,
   1.82`, 1.94`, 9.3`, 6.9`, 8.1`};


Simulated = {2.633416779`, 6.759191326`, 1.080474604`, 0.483434196`,
   4.043855305`, 5.528524842`, 1.29943604`, 0.611382606`,
   1.227835857`, 3.377471292`, 1.797105286`, 1.205274226`,
   1.504191906`, 5.109073793`, 1.688226935`, 1.734784029`,
   1.003924369`, 6.68354987`, 0.931595386`, 6.33655636`, 9.193555892`,
    3.667034246`, 0.717187037`, 3.419391237`, 0.664992403`,
   7.710793921`, 1.21714276`, 5.040199976`, 0.542136072`,
   8.358085894`, 3.838614605`, 1.354210476`, 1.479712701`,
   2.210486301`, 8.282363095`, 9.88117456`, 8.551142833`,
   1.546290679`, 8.029122314`, 1.554809371`, 5.757665578`,
   0.817604024`, 1.582081792`, 0.885892689`, 3.177418498`, 6.5210536`,
    0.785657138`, 1.41451306`, 2.219253757`, 1.819943037`,
   1.818454316`, 1.948748007`, 10.13449034`, 6.052318273`,
   7.156680471`};

ListLinePlot[{Observed, Simulated}]