hi, iam new in the community. i would like to ask how to plot two different functions with different intervals
for example
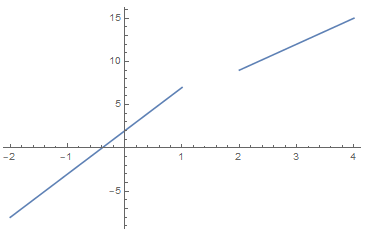
y=3x+3, x>=2
y=5x+2 x<1
You could use Show to "merge" plots
Show
Show[
    Plot[3 x + 3, {x, 2, 4}],
    Plot[5 x + 2, {x, -2, 1}],
    PlotRange -> All, AxesOrigin -> {0, 0}
 ]