Group Abstract Group Abstract

Message Boards Message Boards

2
|
5.2K Views
|
6 Replies
|
4 Total Likes
View groups...
Share
Share this post:

Make Y-axis ticks visible in LogPlot (V12)?

Posted 6 years ago

Why the y-axis ticks are almost invisible (light grey in color) when a graph is saved as svg in both Mathematica 11.3 and 12 (I use ubuntu 18.04):

LogPlot[Exp[-t], {t, 0.0, 2.0}, 
 PlotRange -> {{0.0, 1.5}, {0.01, 10^0}}, Frame -> True, 
 FrameStyle -> Directive[Black, Thick], 
 FrameTicksStyle -> Directive[Black, FontOpacity -> 1, 20], 
 PlotStyle -> {Black, Thickness[0.005]}, AspectRatio -> 1/GoldenRatio] 

enter image description here

POSTED BY: Psi Meson
6 Replies

A simple way to diminish that problem is to use GridLines. With that option IMHO graphics become more appealing anyway!

LogPlot[Exp[-t], {t, 0.0, 2.0}, 
 PlotRange -> {{0.0, 1.5}, {0.01, 10^0}}, Frame -> True, 
 FrameStyle -> Directive[Black, Thick], 
 FrameTicksStyle -> Directive[Black, FontOpacity -> 1, 20], 
 PlotStyle -> {Black, Thickness[0.005]}, AspectRatio -> 1/GoldenRatio,
 GridLines -> {Automatic, Flatten[Range[10] # & /@ {.01, .1, 1}]}]
POSTED BY: Henrik Schachner
Posted 6 years ago

Hi Neil,

Thanks for taking a look at it. I think I have no other options than to use the workaround you suggested.

POSTED BY: Psi Meson

I forwarded this thread to support. They confirmed the bug and forwarded it to the developers.

Did my workaround help you?

Regards,

Neil

POSTED BY: Neil Singer

There is a workaround but you must then specify everything about your ticks.

ticksv[min_, max_] := 
 Table[{i, Style[i, 12], {.02, 0}, Thick}, {i, 0, max, 0.2}]

ticksh[min_, max_] := 
 Table[{i, Style[i, 12], {.02, 0}, Directive[Red, Thick]}, {i, 0.5, 
   max, 0.5}]

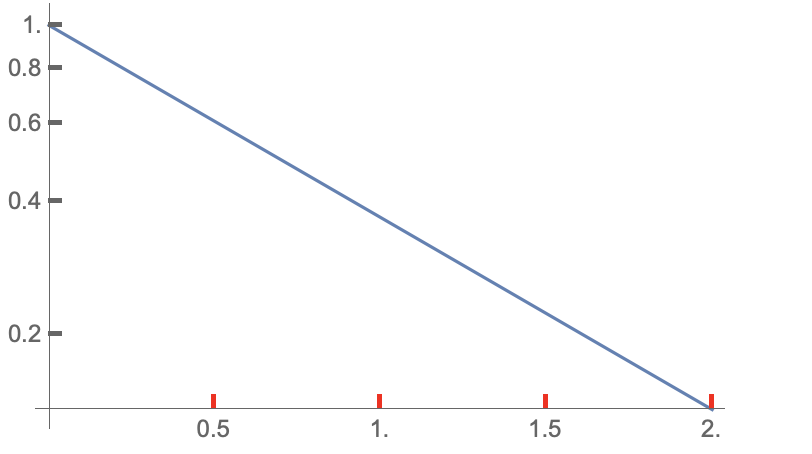
LogPlot[Exp[-t], {t, 0.0, 2.0}, Ticks -> {ticksh, ticksv}]

to get

enter image description here

Regards,

Neil

POSTED BY: Neil Singer

It looks like a bug in LogPlot. Thickness has effect only on the ticks on the bottom of the frame:

LogPlot[Exp[-t], {t, 0.0, 2.0}, Frame -> True,
 FrameTicksStyle ->
  {{Directive[Black, Thickness[0.01`]],
    Directive[Blue, Thickness[0.01`]]},
   {Directive[Red, Thickness[0.01`]],
    Directive[Green, Thickness[0.01`]]}}]
POSTED BY: Gianluca Gorni
Posted 6 years ago

Is there a way to get around it?

POSTED BY: Psi Meson
Reply to this discussion
Community posts can be styled and formatted using the Markdown syntax.
Reply Preview
Attachments
Remove
or Discard