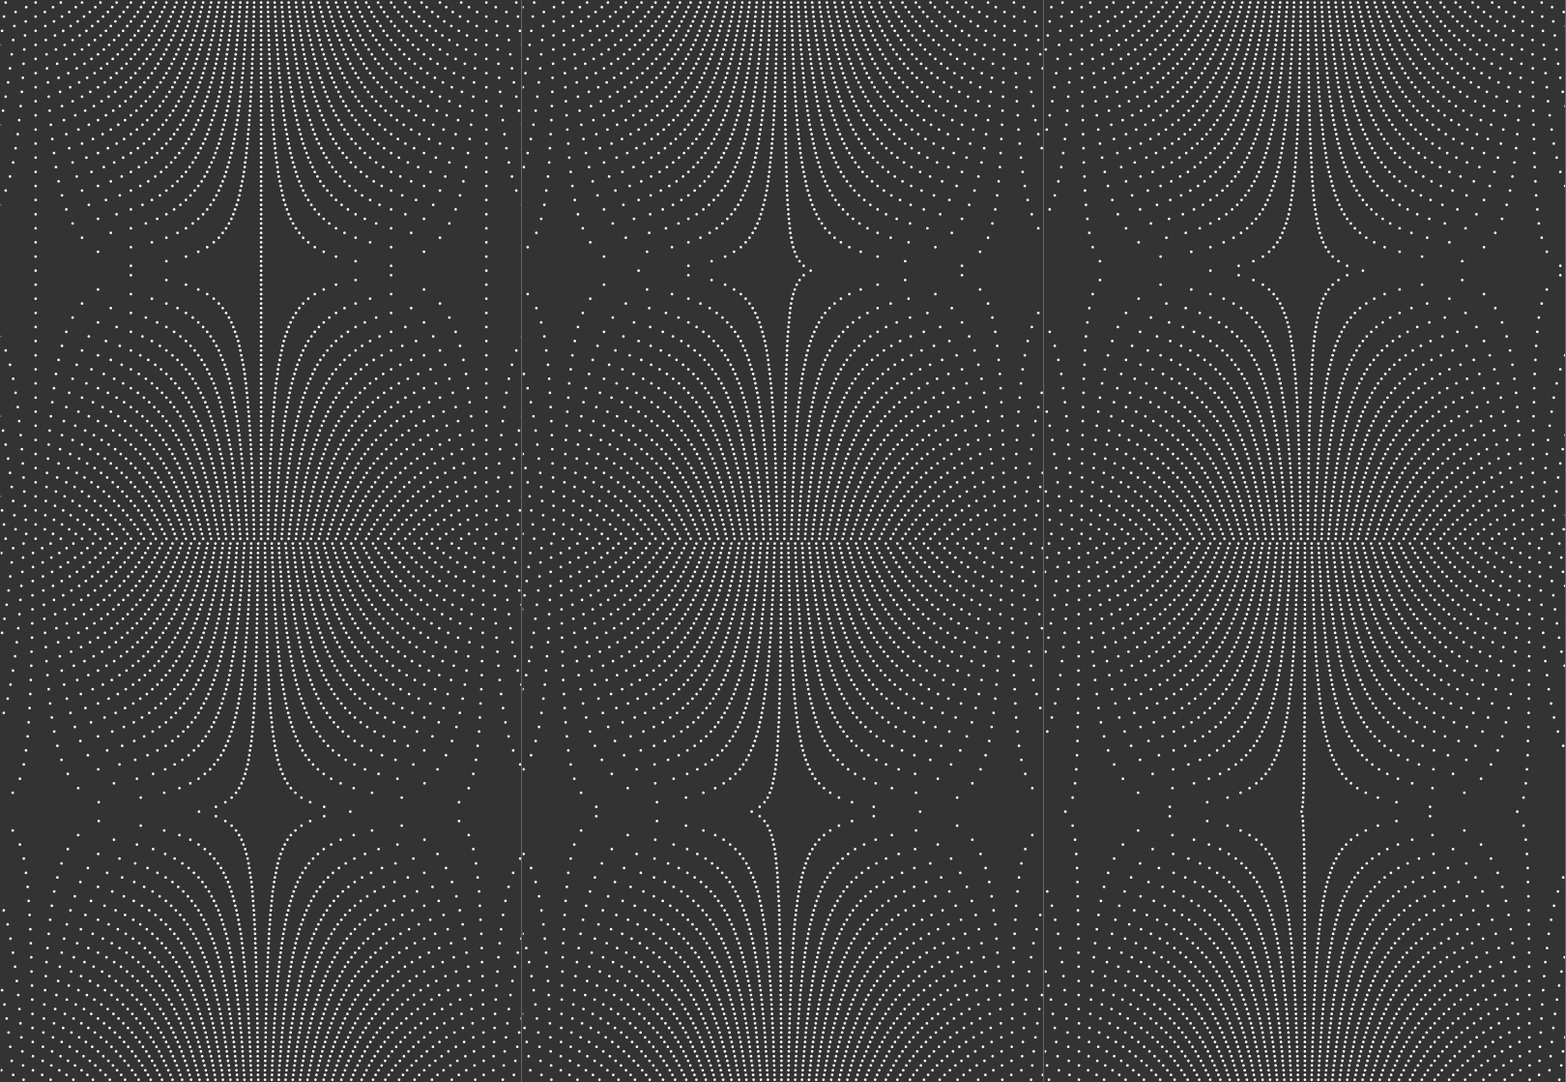
Off the End
Each horizontal row shows the stereographic projection to the line of (the vertices of) a rotating regular polygon. The middle row shows the image of the vertices of an equilateral triangle, the rows above and below show a square, the rows above and below that a regular pentagon, etc. The speeds are all chosen so that one vertex passes through the south pole of the unit circle every $\frac{4}{5}$ of a second, which obviously means the triangle is spinning much faster than the regular 60-gon that shows up in the first and last rows. Here's an unoptimized animation showing all the rotating polygons to get a sense of their relative speeds:

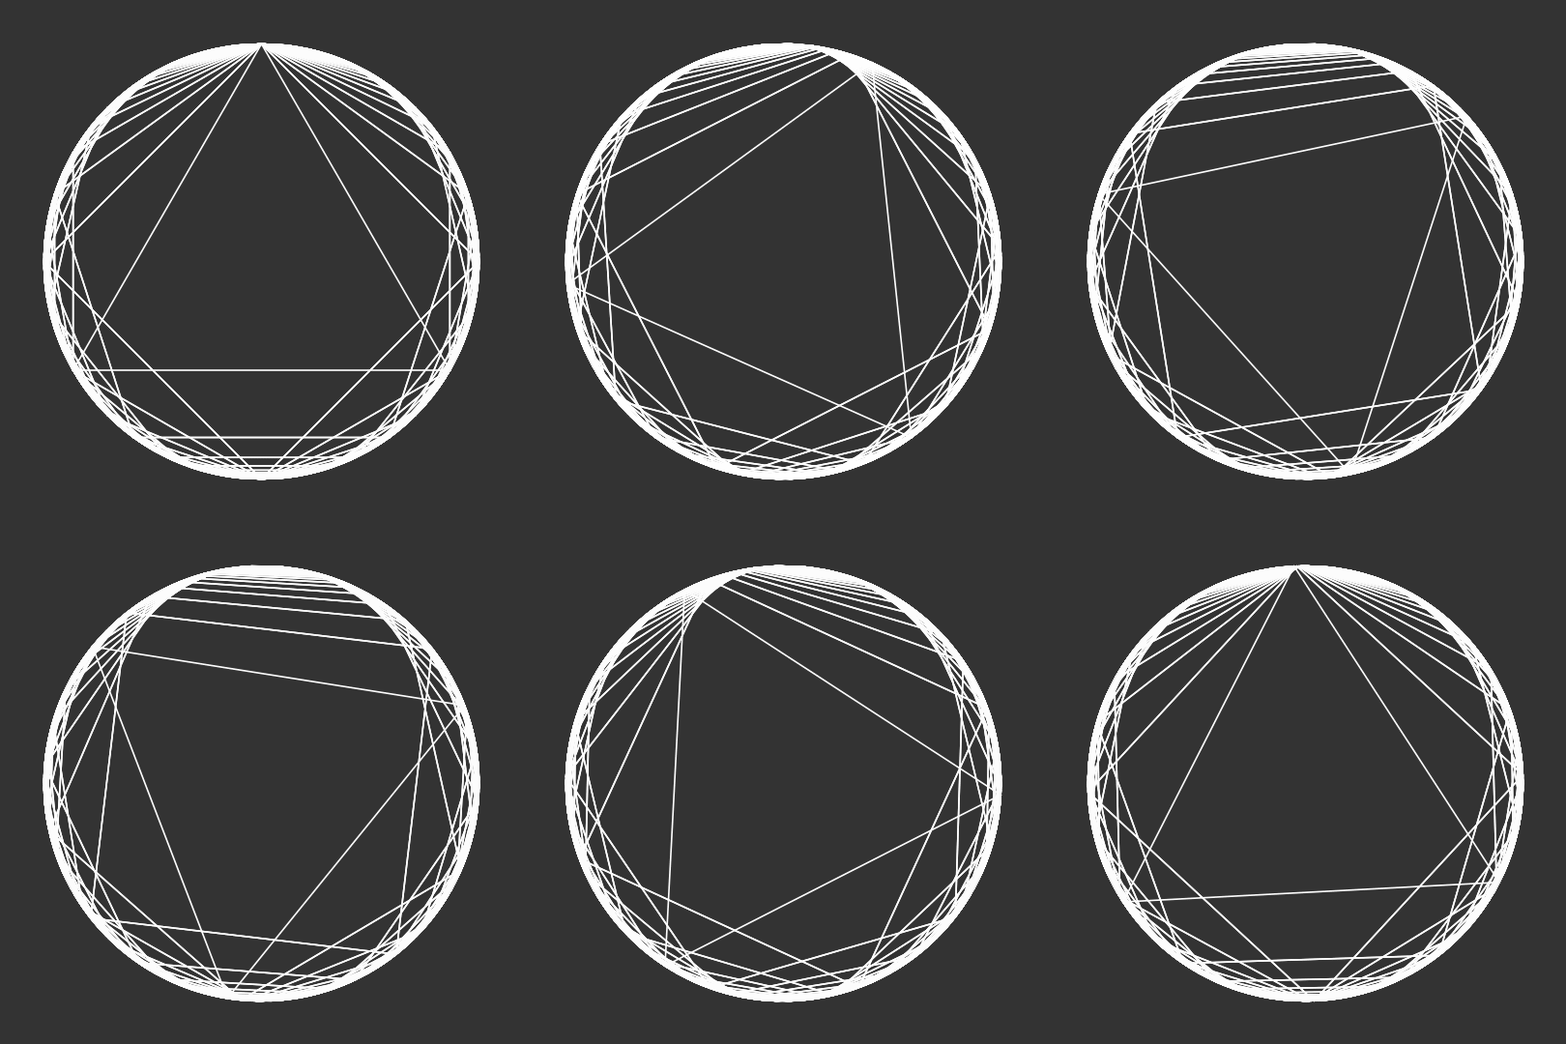
Of course, this uses stereographic projection:
Stereo[p_] := p[[;; -2]]/(1 + p[[-1]]);
The actual image is set up as a GraphicsGrid; note that offset just a small irrational number to ensure that none of the polygon vertices pass through the north pole (where stereographic projection is undefined) at any of the time steps.
With[{bg = GrayLevel[.2], max = 60, offset = Sqrt[2.]/1000000},
 Manipulate[
    GraphicsGrid[
     Table[
      {Graphics[
        {White, PointSize[.005],
         Table[
            Point[Append[Stereo[ReIm[Exp[I (-2 ? t/n + ?/2 + 2 ? i/n)]]], 0]],
          {i, 1, n}]},
        Background -> bg, PlotRange -> {{-2, 2}, {-.0125, .0125}}]},
      {n, Join[Reverse[Range[4, max]], Range[3, max]]}],
     ImageSize -> 540, Background -> bg, Spacings -> 1,
     PlotRangePadding -> None],
    {t, offset, 1 + offset - #, #}] &[1/40]
 ]