Hi,
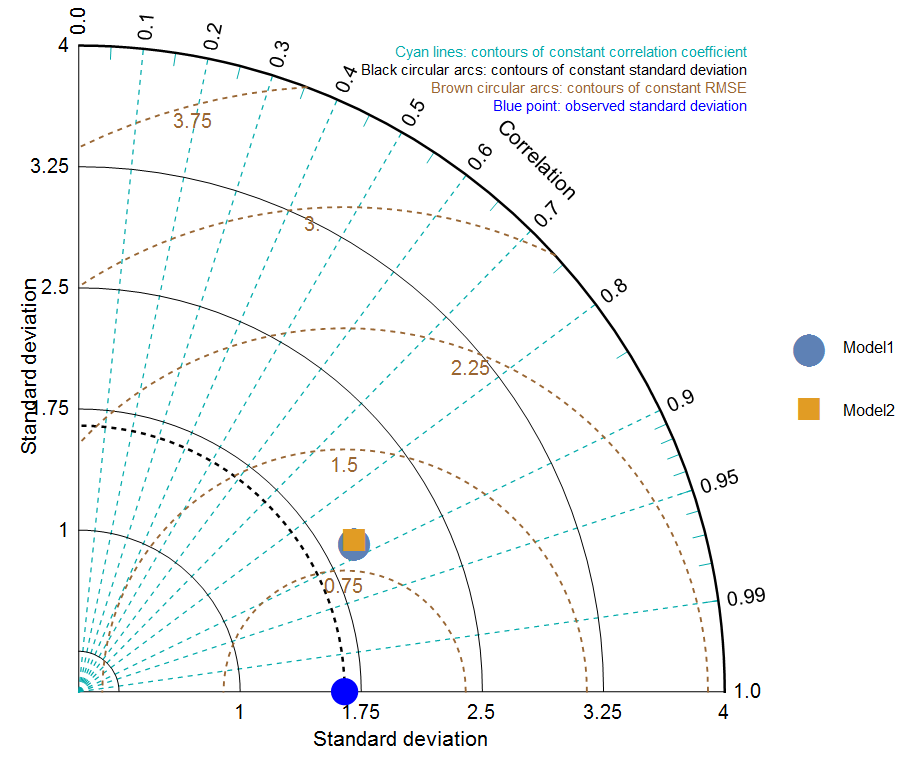
Is there any numerical way to find the closer model (Model1 or Model 2) to the Bluepoint (Observed) in the Taylor Plot?
Observed = {8.241666666666665`, 9.533333333333333`, 10.629166666666666`,
   11.8125`, 13.429166666666669`, 13.583333333333332`, 12.454166666666666`,
   11.166666666666666`, 11.024999999999999`, 11.074999999999998`};

Model1 = {7.388576416143433`, 8.611162282190872`, 9.708615798586239`,
   10.676244526223503`, 11.756032351657968`, 13.282924395953437`,
   13.431274460380749`, 12.355429878281225`, 11.162417014336363`,
   11.03356816155934`};

Model2 = {7.388576416143433`, 8.611162282190872`, 9.708615798586239`,
   10.676244526223503`, 11.756032351657968`, 13.282924395953437`,
   13.431274460380749`, 12.355429878281225`, 11.162417014336363`,
   11.03356816155934`};

Mean:

{mObserved, mModel1, mModel2} = Mean /@ {Observed, Model1, Model2}

{11.295, 10.9406, 10.9406}

Standard deviations:

{sdObserved, sdModel1, sdModel2} =
 StandardDeviation /@ {Observed, Model1, Model2}

{1.64688, 1.94494, 1.94494}

Correlation coefficients:

{ccObserved, ccModel1, ccModel2} =
 Correlation[YObserved, #] & /@ {Observed, Model1, Model2}

{1., 0.879641, 0.879641}

rmse[obs_, model_] :=
 Sqrt[Length[obs]/(Length[obs] - 1)]
   RootMeanSquare[(obs - Mean[obs]) - (model - Mean[model])]

{rmseModel1, rmseModel2} = rmse[Observed, #] & /@ {Model1, Model2}

{0.927299, 0.927299}

Taylor Diagram

taylorDiagram[obs_, models_, labels_, maxSD_, stepRMSE_] :=
 Module[{ticksize = 0.02, frameticksoffset = 0.014,
   label = "Standard deviation", corrlabel = "Correlation",
   radialcolor = Darker@Cyan, observedcolor = Blue, rmsarccolor = Brown,
   RadialPosition, RadialLine, arcs, radial, tickmarks, frameticks,
   frameticklabels, axesticks, framelabels, origin = StandardDeviation[obs],
   datapoints, meanarc, CreateRMSarcs, rmsarcs, sdtext, rmsetext, cctext,
   obstext, sdo = StandardDeviation[obs],
   sdm = StandardDeviation[#] & /@ models, rmses, points},
  rmses = Sqrt[
       Length[obs]/(Length[obs] - 1)] RootMeanSquare[(obs - Mean[obs]) - (# -
          Mean[#])] & /@ models;
  points = MapThread[
    Select[{x, y} /.
       NSolve[{x^2 + y^2 == #1^2, (x - sdo)^2 + y^2 == #2^2}, {x,
         y}], #[[1]] > 0 && #[[2]] > 0 &] &, {sdm, rmses}];
  arcs = Circle[{0, 0}, #, {0, Pi/2}] & /@ Range[maxSD, 0, -stepRMSE];
  arcs[[1]] = {Thick, arcs[[1]]};
  RadialPosition[corr_?NumericQ] := AngleVector[{maxSD, ArcCos[corr]}];
  RadialLine[corr_?NumericQ] := {{0, 0}, RadialPosition[corr]};
  radial = {{Black, Line[RadialLine /@ {0, 1}]}, {radialcolor, Dashed,
     Line[RadialLine /@ Join[Range[0.1, 0.9, 0.1], {0.95, 0.99}]]}};
  tickmarks =
   RadialPosition /@ Join[Range[0.05, 0.85, 0.1], Range[0.91, 0.99, 0.01]];
  tickmarks = {#, (1 - ticksize) #} & /@ tickmarks;
  tickmarks = {radialcolor, Line[tickmarks]};
  frameticks = Range[0, 1, 0.1]~Join~{0.95, 0.99};
  frameticklabels =
   If[Round[#, 0.1] == #, NumberForm[#, {\[Infinity], 1}], #] & /@ frameticks;
  frameticks =
   MapThread[
    Text[#1, (1 + frameticksoffset) #2, {-1, 0},
      AngleVector[#3]] &, {frameticklabels, RadialPosition /@ frameticks,
     ArcCos[frameticks]}];
  axesticks = Range[maxSD, stepRMSE, -stepRMSE];
  axesticks = Join[
    Text[If[Round[#] == #, Round[#], #], {#, -maxSD frameticksoffset}, {0,
        1}] & /@ axesticks,
    Text[If[Round[#] == #, Round[#], #], {-maxSD frameticksoffset, #}, {1,
        0}] & /@ axesticks];
  framelabels = {
    Text[Style[label, 17], {maxSD/2, -4 maxSD frameticksoffset}, {0, 1}],
    Text[Style[label, 17], {-4 maxSD frameticksoffset, maxSD/2}, {0, -1}, {0,
      1}],
    Text[Style[corrlabel, 17],
     AngleVector[{(1 + 6 frameticksoffset) maxSD, 45 \[Degree]}], {1, 0},
     AngleVector[-45 \[Degree]]]};
  datapoints = {{observedcolor, PointSize[0.038], Point[{origin, 0}]}};
  meanarc = {Black, Thick, Dashed, Circle[{0, 0}, origin, {0, Pi/2}]};
  CreateRMSarcs[origin_, arcsize_, maxsize_] := Module[{start, stop},
    start = If[origin + arcsize > maxsize,
      Pi - ArcCos[(maxsize^2 - arcsize^2 - origin^2)/(-2 arcsize origin)], 0];
    stop = If[origin - arcsize >= 0, Pi, Pi - ArcCos[origin/arcsize]];
    {Dashed, AbsoluteThickness[1.5], rmsarccolor,
     Circle[{origin, 0}, arcsize, {start, stop}],
     Text[arcsize,
      AngleVector[{origin, 0}, {arcsize - 0.025 maxsize, (stop + start)/2}]]}];
  rmsarcs =
   CreateRMSarcs[origin, #, maxSD] & /@ Range[stepRMSE, maxSD, stepRMSE];
  cctext =
   Text[Style["Cyan lines: contours of constant correlation coefficient", 12],
     Scaled[{1, 0.97}], {1, 1}];
  sdtext =
   Text[Style["Black circular arcs: contours of constant standard deviation",
     12], Scaled[{1, 0.945}], {1, 1}];
  rmsetext =
   Text[Style["Brown circular arcs: contours of constant RMSE", 12],
    Scaled[{1, 0.92}], {1, 1}];
  obstext =
   Text[Style["Blue point: observed standard deviation", 12],
    Scaled[{1, 0.895}], {1, 1}];
  Show[Graphics[{radial, tickmarks, arcs, frameticks, axesticks, framelabels,
     meanarc, datapoints, rmsarcs, Darker@Cyan, cctext, Black, sdtext, Brown,
     rmsetext, Blue, obstext}, ImageSize -> 600],
   ListPlot[points, PlotMarkers -> {Automatic, 40}, PlotLegends -> labels],
   BaseStyle -> 16]]

Taylor Plot

pT = taylorDiagram[Observed, {Model1, Model2}, {"Model1", "Model2"}, 4, .75]