Message Boards Message Boards

0
|
3242 Views
|
9 Replies
|
0 Total Likes
View groups...
Share
Share this post:

[?] Plot a blank Cartesian plane?

Posted 5 years ago

Hi everyone,

A very simple question, please. I need to plot a blank Cartesian coordinate plane for students to use to plot graphs.

Thank you.

Stanley

POSTED BY: Stanley Max
9 Replies
Posted 5 years ago

Hi Rohit,

OK. I finally got it to work. I have to say, however, Mathematica is a wonderful program, but they don't make doing this -- putting arrows at the ends of the curve -- very easy at all.

So thank you once again. You have been tremendously helpful to me.

Stanley

POSTED BY: Stanley Max
Posted 5 years ago

Hi Rohit,

OK. I am working on this. I haven't succeeded yet, but I will continue to try.

I will let you know when I get it.

You have been very helpful to me, and I appreciate it.

Stanley

POSTED BY: Stanley Max
Posted 5 years ago

Hi Stanley,

Adding arrowheads to the ends of a function plot can also be done using Epilog. e.g.

f[x_] := x^2;

{min, max} = {-10, 10};

Plot[f[x], {x, min, max}, PlotRange -> All, GridLines -> Full, 
 AspectRatio -> 1, Frame -> True, FrameTicks -> None, Ticks -> None, 
 Epilog -> {Arrow[{{min, f[min]}, {min - 0.1, f[min - 0.1]}}], 
   Arrow[{{max, f[max]}, {max + 0.1, f[max + 0.1]}}]}]

enter image description here

If you want additional arrows for the axes as in the previous example, just add them to the Epilog list.

POSTED BY: Rohit Namjoshi
Posted 5 years ago

Hi Rohit,

May I please ask one more question.

I need the arrows to show up on the graphed line. For example, I need both ends of the linear function or both ends of the quadratic function to have an arrowhead.

I have studied the documentation, and it seems tremendously complicated. There must be a simple command to add arrowheads.

Thank you for your consideration.

Stanley

POSTED BY: Stanley Max
Posted 5 years ago

Hi Rohit,

Once again, just perfect. Thank you so much.

Stanley

POSTED BY: Stanley Max
Posted 5 years ago

Stanley,

You will have to manually adjust the coordinates and offsets to get the look that you want.

range = {-10, 10};
Plot[Null, {x, Sequence @@ range}, PlotRange -> {range, range}, 
 GridLines -> Full, AspectRatio -> 1, Frame -> True, 
 FrameTicks -> None, Ticks -> None, 
 Epilog -> {Arrow[{{-10, 0}, {10.8, 0}}], 
   Arrow[{{0, -10}, {0, 10.8}}]}, ImagePadding -> 40, 
 PlotRangeClipping -> False, 
 AxesLabel -> {Row[{Spacer[{10, 0}], Style["x", 14, Bold]}], 
   Column[{Style["y", 14, Bold], Spacer[{0, 0}]}]}]
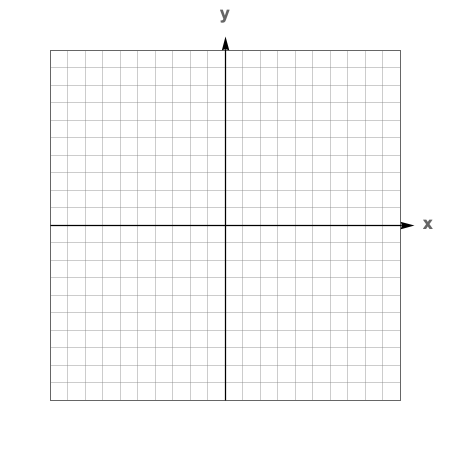
enter image description here

POSTED BY: Rohit Namjoshi
Posted 5 years ago

Hi Rohit or anyone else,

I have a few brief followups, please:

  • I don't want the numbers to show..

  • I do want the axes to be shown in bold with arrows. I know that, to do this, the following code works: AxesStyle -> Arrowheads[0.05] But how do I get the axes to stick out a little farther so that the arrowheads stick out of the main portion of the graph?

  • And finally, to print x and y, I know to do the following: AxesLabel -> {x, y} But how do I make those two letters show bolder?

Thank you.

Stanley

POSTED BY: Stanley Max
Posted 5 years ago

Hi Rohit,

Perfect! Thank you so much.

Stanley

POSTED BY: Stanley Max
Posted 5 years ago

Stanley,

Something like this?

range = {-10, 10};
Plot[Null, {x, Sequence @@ range}, PlotRange -> {range, range}, GridLines -> Full, 
  AspectRatio -> 1, Frame -> True]

enter image description here

POSTED BY: Rohit Namjoshi
Reply to this discussion
Community posts can be styled and formatted using the Markdown syntax.
Reply Preview
Attachments
Remove
or Discard

Group Abstract Group Abstract