The multiobjective optimization problem solved here is described at https://www.math.unipd.it/~marcuzzi/DIDATTICA/LEZ&ESE_PIAI_Matematica/3_cones.pdf
where it is solved with a variety of solvers.
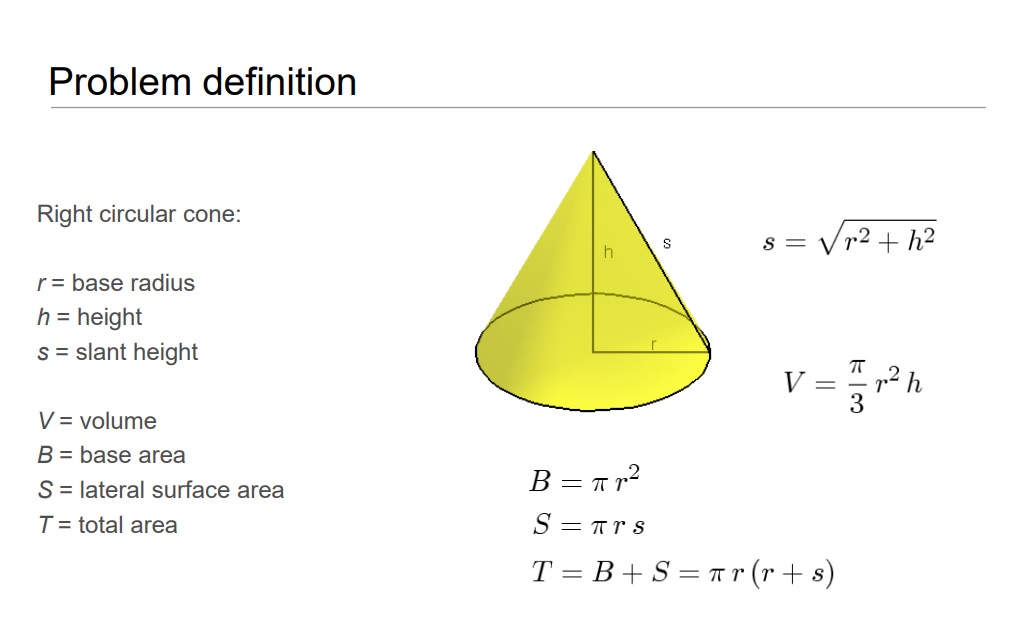
The problem concerns a cone with radius r and height h.
In[1]:= vars = {r, h};
The radius is constrained to be between 0 and 10; the height is constrained to be between 0 and 20; the volume is constrained to be greater than 200.
In[2]:= cons = {0 <= r <= 10, 0 <= h <= 20, \[Pi]/3 r^2 h >= 200};
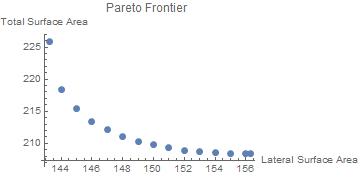
The two objectives to be minimized are the lateral surface area of the cone and the total surface area of the cone .
In[3]:= objs = {\[Pi] r Sqrt[r^2 + h^2], \[Pi] r (r + Sqrt[r^2 + h^2])};
The goal is to find the Pareto frontier of the problem. For any point on the frontier, there is no other allowed point which has lower values for both objective functions.
Minimizing the first objective function gives the following results for the objective functions and the variables. (For a more complicated problem, NArgMin would be used).
In[4]:= min1 = ArgMin[{objs[[1]], cons}, vars];
In[5]:= N[minpt1 = {objs, vars} /. Thread[{r, h} -> min1]]
Out[5]= {{143.23, 225.924}, {5.13053, 7.25566}}
Minimizing the second objective function gives the following results for the objective functions and the variables. (Note that converting the result to numeric form introduces a small imaginary part.)
In[6]:= min2 = ArgMin[{objs[[2]], cons}, vars];
In[7]:= N[minpt2 = {objs, vars} /. Thread[{r, h} -> min2]]
Out[7]= {{156.282 - 9.20201*10^-7 I,
208.376 + 6.89458*10^-22 I}, {4.0721 + 3.59653*10^-8 I,
11.5176 - 2.03451*10^-7 I}}
This function calculates the variables when minimizing the second objective function with the first objective function constrained to a constant.
In[8]:= f[o1_] := ArgMin[{objs[[2]], Join[{o1 == objs[[1]]}, cons]}, vars]
The variable values are calculated for a number of values in the range of the first objective function, as determined from minpt1 and minpt2.
In[9]:= AbsoluteTiming[res = Table[f[o1], {o1, 144, 156}];]
Out[9]= {72.1091, Null}
The results are converted to the values of the objective functions and the variables
In[10]:= res1 = Table[{objs, vars} /. Thread[vars -> res[[i]]], {i, Length[res]}];
The values at the end points are added and the results plotted.
In[11]:= res2 = Join[res1, {minpt1, minpt2}];