Introduction
Just as Auguste Comte, Karl Marx, Max Weber, and Emile Durkheim are key figures in the discipline of sociology in general, C.W. Mills is a key person in U.S. contexts (as are W.E.B. Du Bois and Charlotte Perkins Gilman). To study anything through a "sociological" lens requires the utilization of Mills' "sociological imagination." Simply put, this is identifying when certain personal problems are structural ills. Unsurprisingly, there is an annual book award in his honor, the "C. Wright Mills Award." Though the field of bibliometrics is replete with citation analysis, a gap may exist regarding acknowledgements. Thus, my exploratory project concerns ascertaining what patterns may emerge with respect to acknowledgments in each and all of the books that have won the Mills Award to date. With the help of two RAs (Julian Petoske and Zury Rodriguez), specific book information was entered into an Excel spreadsheet. The data from the Excel file was then cleaned and analyzed via Mathematica at the 2019 Wolfram Summer Program with the invaluable help of two key Wolfram personnel (Bob Nachbar and Jesse Friedman). There was a total of 63 books, 68 authors (5 books were co-written), and a total of 2530 acknowledgments whereby 2369 were unique acknowledgements, spanning the years from 1964 through 2017.
A Little bit about myself
I have been curious about many things for many years. So curious, in fact, that I have various academic degrees from seemingly-disparate fields (business, sociology, and theology). Call me dumb or persistent - both? And so, before my life goes around the sun for a 49th time, I have been investigating historical documents and how the WL may elucidate social networks. And recently, the prefaces of a select group of books have peaked my interest. Last year my RA (Hannah Garringer) came to the 2018 WSS and told me to apply/attend. And so, with the guidance of some mentors, I was able to add another tool to my toolkit in this ongoing journey of having the privilege, and blessing, to continue to explore and find nothing.
A few Snippets from my Project
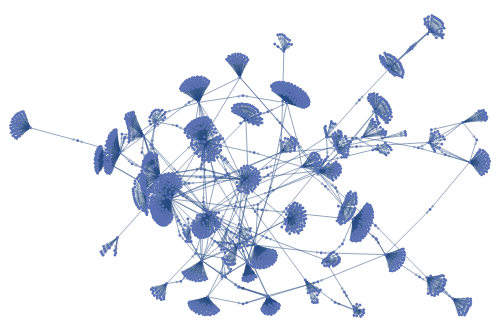
This picture shows something and yet also nothing, it represents my project very well.
graphsPerYear = AssociationMap[
   Graph[removeDisconnectedNetworks[
      edgesFromWinners[bookWinnersForYear[#]]],
     VertexLabels -> "Name", ImageSize -> 500]
    &, Sort@integerYearBookWinnersSplitAuthors[[All, "Year"]]];
accumulatingGraphs = AssociationMap[
   Graph[removeDisconnectedNetworks[
      edgesFromWinners[bookWinnersBetweenYears[yearsRange[[1]], #]]],
     VertexLabels -> "", ImageSize -> 500]
    &, Range @@ yearsRange];
accumulatingGraphs[2017]
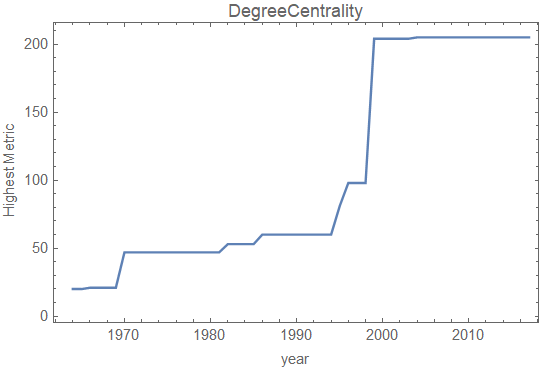
One of the SNA metrics I explored was DegreeCentrality. Below is an extraction of the highest score, per given year, and a simple regression of the respective data points. I know it's not fancy code, it's not standard protocol with respect to the WL, and for some it may be mind-dumbing - but you know what? I'm having fun and learning some things along the way.
DegreeCentrality
topConnectedPersonsDegreeCentrality =
  gleanWellConnectedPersons[#, "measure" -> DegreeCentrality] & /@
   accumulatingGraphs;
yearAndSNAs =
  KeyValueMap[{#1, Last /@ #2} &, topConnectedPersonsDegreeCentrality];
MapAt[Max, yearAndSNAs, {All, 2}];
data = %;
lmfData = data[[All, 2]]
ListLinePlot[MapAt[Max, yearAndSNAs, {All, 2}],
 FrameLabel -> {"year", "Highest Metric"}, Axes -> False,
 Frame -> True, PlotLabel -> DegreeCentrality]
LinearModelFit[lmfData, {1, x}, x]

{20, 20, 21, 21, 21, 21, 47, 47, 47, 47, 47, 47, 47, 47, 47, 47, 47, \
47, 53, 53, 53, 53, 60, 60, 60, 60, 60, 60, 60, 60, 60, 81, 98, 98, \
98, 204, 204, 204, 204, 204, 205, 205, 205, 205, 205, 205, 205, 205, \
205, 205, 205, 205, 205, 205}
Some Tentative Findings and More Work Ahead
This project revealed that where one received a PhD was more important than where one went to college, with respect to the Mills award. Also, winning the award appears to be related residing at Berkeley, Harvard, Columbia, Princeton, or Chicago (the top five institutions, respectively, won 24 out of 63 winning books). Further, getting a PhD from Harvard, Berkeley, Chicago, and Columbia accounted for 24 out of the 68 winners (respectively, 11, 5, 4, and 4). I did not try more tests, such as TimeSeriesModel or more elaborate tests such as Classify or PredictorFunction. Nor did I have the abilities to explore TimeSeries in more depth. However, this exploratory project does provide some proof of concept. For example, with the LinearModelFit (and TImeSeries) results, these outputs can serve as a heuristic baseline to compare other respective studies (acknowledgements in a select group of prefaces). Unfortunately, testing for nonlinearities and ratios of change were outside of my abilities. I suppose if ratios of change, as a function of time could be mapped, then one may even explore aspects from my original proposal: 1) Dunbar's 2) Zipf's, 3) Sarnoff's, 4) Odlyzko's, 5) Metcalfe's, 6) Reed's, 7) Feigenbaum's Constant, and any others that measure (rates of) change? And here I really start rambling into Neverland, what about 8) Cellular Automata, 9) Agent Based Modeling, 10) Self-Organized Criticality, 11) Phase Transitions and12) Fractal Geometry? What appropriate Functions [ ] can help elucidate "thank you?" Finally, can key nodes or links be highlighted (visualizations) using a Manipulate Function (for years 1 to n)? If some of these questions can be ascertained from Mills corpus, can these test be replicated with another corpus of "winners"?
I learned, first and foremost, exploring and finding nothing - and having both pain and joy in the process. It took more time than I thought to prepare the data with Mathematica. And it was more challenging than I thought it would be to create the requisite functions to analyze the data in a directed graph and preclude the disconnected sub-graphs. Nonetheless, I did find some tentative answers to my initial research. And, I realized, my stupid computer won't do what I want it to do; it only does what I tell it to do!


