Introduction
In my project, I sought to develop a function to generate Pictograms. Pictograms are used to display information as images so that it is quickly understood by a viewer. As a result, I wanted my function to be extremely customizable and fit a variety of different use cases. To meet this objective, I selected multiple Pictograms online in attempts to capture the numerous ways to display data.
Function Usage
Pictogram[data] returns a Pictogram displaying data using default Disk graphic. Pictogram[data, opts] returns a Pictogram displaying data with style specified in options.
Input a List
Pictogram[list, opts] returns a Pictogram with row lengths equal to the inputted values.
Pictogram[{1, 2, 3}]
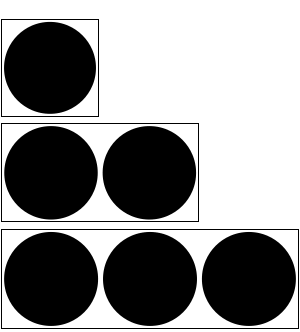
When Data is a list of numbers, Separate specifies whether elements can appear together on a single row or split between distinct rows.
Pictogram[{1, 2, 3}, Separate -> False,
 ChartStyle -> {Red, Blue, Brown}]

When Separate is specified as True, element and style specifications match corresponding rows.
Pictogram[{1, 2, 3},
 ChartElements -> {Graphics[Disk[]], Graphics[Circle[]]},
 ChartStyle -> {Blue, Green, Yellow}]
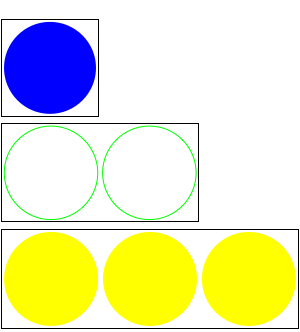
When Separate is specified as False, labels for each element can be provided as a list using the Labels option. The magnification of these labels can be specified with LegendMagnification.
Pictogram[{1, 2, 3}, Labels -> {"Red", "Blue", "Brown"},
 Separate -> False, ChartStyle -> {Red, Blue, Brown}]

Input an Association
Pictogram[association, opts] returns a Pictogram in which the keys of the association become the labels for the rows.
Pictogram[<|"A" -> {1}, "B" -> {2}|>]
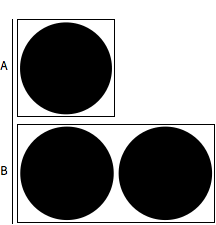
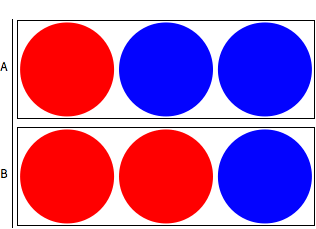
Data formatted as lists of more than one integer are turned into rows constituted by distinct repeated objects. Each list element refers to distinct object type. Objects and their styles must (currently) be specified in options.
Pictogram[<|"A" -> {1, 2}, "B" -> {2, 1}|>, ChartStyle -> {Red, Blue}]
Style and Element Specification
Using the ChartStyle and ChartElement options, one can specify the Image/Graphics and styles desired. When using Graphics or Graphics3D, ChartStyle defaults to coloring them black. With Image, ChartStyle defaults to returning the original Image:
Pictogram[<|"A" -> {1, 2}, "B" -> {2, 1}|>,
 ChartElements -> {Graphics3D[Sphere[]], Graphics[Circle[]]},
 ChartStyle -> {Purple, Blue}]
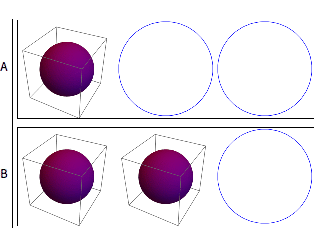
ChartStyle supports all Graphics directives for Graphics and Graphics3D.
Pictogram[<|"A" -> {1, 2}, "B" -> {2, 1}|>,
 ChartStyle -> {Directive[Hue[0.1], Opacity[0.2]], Hue[0.1]}]
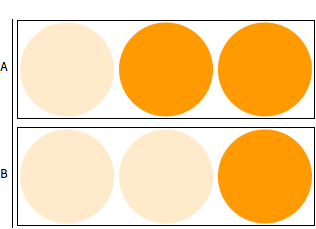
ChartStyle with Image supports:
Opacity[]Image coloring specifications (Hue[], Color, etc.) in a sublist. (Image is colorized as a whole; white backgrounds are affected as well). Opacity[] must be specified first.
Pictogram[<|"A" -> {1}, "B" -> {2}|>, ChartElements -> {Ball[Image[...]]},
     ChartStyle -> {{Opacity[0.7], Hue[0.1]}}]
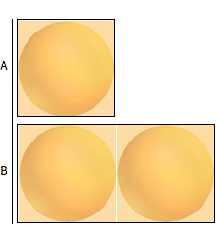
Other Options
Counts displays the counts of each object to the right of the Pictogram.
Pictogram[<|"A" -> {1, 2}, "B" -> {2, 1}|>, ChartElements -> {},
 ChartStyle -> {Directive[Hue[0.1], Opacity[0.2]], Hue[0.1]},
 Counts -> True]
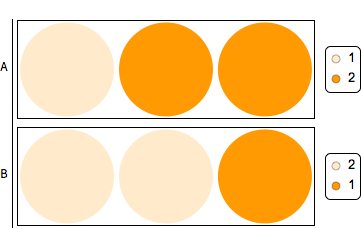
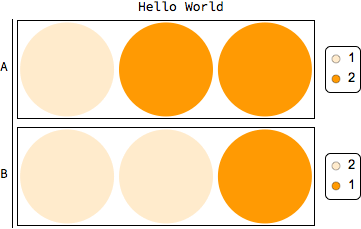
Title specifies a title displayed above the Pictogram.
Pictogram[<|"A" -> {1, 2}, "B" -> {2, 1}|>, ChartElements -> {},
 ChartStyle -> {Directive[Hue[0.1], Opacity[0.2]], Hue[0.1]},
 Counts -> True, Title -> "Hello World"]
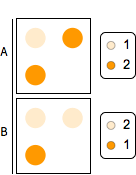
ImageSize and DisplayWidth specify the desired image widths of all elements as well as the width of the Grid of objects.
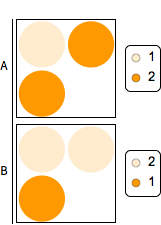
Spacings specifies the spacing between objects, and Magnification changes their magnification.
Pictogram[<|"A" -> {1, 2}, "B" -> {2, 1}|>, ChartElements -> {},
 ChartStyle -> {Directive[Hue[0.1], Opacity[0.2]], Hue[0.1]},
 Counts -> True, ImageSize -> 50, DisplayWidth -> 300,
 Magnification -> 0.25, Spacings -> 1]
Some Examples
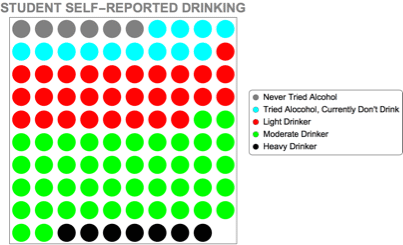
Pictogram[{6, 13, 29, 44, 7},
 Labels -> {"Never Tried Alcohol",
   "Tried Alcohol, Currently Don't Drink", "Light Drinker",
   "Moderate Drinker", "Heavy Drinker"},
 Title -> Text[
   Style["STUDENT SELF-REPORTED DRINKING", Bold, Gray,
    FontSize -> 40]], ChartStyle -> {Gray, Cyan, Red, Green, Black},
 Separate -> False, ChartStyle -> {Red, Green}, Magnification -> 1,
 LegendMagnification -> 2, DisplayWidth -> 700, Spacings -> 0.2,
 ImageSize -> 50, Frame -> True, Counts -> False]
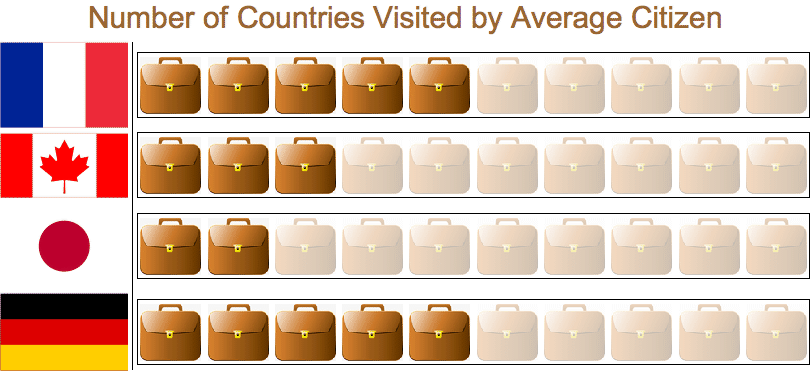
Pictogram[assoc1, ChartElements -> {, },
 ChartStyle -> {{}, {Opacity[0.3]}},
 Title -> Text[
   Style["Number of Countries Visited by Average Citizen", Brown,
    FontSize -> 30]], Magnification -> 0.75, DisplayWidth -> 1000,
 Spacings -> 0.1, ImageSize -> 75, Frame -> True, Counts -> False,
 Magnification -> 0.3]
Limitations
For me, the best way to learn the limitations of code is to use it for a variety of uses. That is what I've tried to accomplish throughout my trials here -- looking online at examples, thinking of some on my own, and just trying to create as many different pictograms as possible. Each time I generated a Pictogram, I'd run into a lack of functionality of my code. As a result, I'd add another option and/or alter the function a bit in order to expand its applicability. In doing these trials, I have also encountered some flaws/bugs that require more than a "quick fix." One major example is the manner by which I styled inputted images. My styleImage function, which is primitive at best, applies color functions by blending an image with the colors, hues, etc. specified. This works decently well; however, it colorizes the entire image, which may not work well when an image has a white background that the user does not want to be colorized. For example:
Pictogram[people, ChartElements -> {"Person Image", "Person Image"},
 ChartStyle -> {{Black}, {Red}}, Title -> "Year", Spacings -> 0,
 ImageSize -> 35]

This pictogram is...okay... but what I had wanted was for the figures to be colorized black and red, creating within each row a list of black figures followed by a list of red ones. Obviously, the styleImage function colorized the white background too, producing a pictogram that I could not use (it is too UGLY!). If the people were Graphics (or Graphics3D), however, then they would have been colored as I intended. This leads me to one of the potential future developments of the code: implementing the new Icon entity type. Wolfram just added Icon in the 12.0 update, and these are simply a collection of Graphics representing objects/concepts, perfect for Pictograms! It may be possible to extend the Pictogram[] functionality by developing a Classifier that accepts a String and outputs a related/applicable Icon. For example, if a user wants 3 items of Food, the Classifier may interpret the String "Food" and output an Icon depicting an apple, or something to represent what "Food" means.
Notebook
Attached to this post is a notebook which contains the code used to generate these Pictograms. The top section is a repetition of the functionality I've already highlighted here, but below that is the code and descriptions of some of the functions I created in order to develop these visualizations. As a warning, because I was a bit pressed for time, there are a number of inefficiencies and declarations/expressions that can be abstracted because they are repeated. Later, these inefficiencies and style errors may be fixed to provide a better Pictogram implementation, but the one I have created works fairly well, with not too many bugs. To create your own Pictograms and/or edit the ones I've provided as demonstrations, simply evaluate the entire notebook so that Pictogram[] and its helper functions are defined within your Kernel.
 Attachments: