Introduction
The World Meteorological Organization has over 11,000 weather stations around the world. The data from these devices are continuously recorded into public databases and made available for anyone to download and analyze. Meteorologists regularly inform their viewers with reports produced by Weather, Research & Forecast (WRF) models which analyze these aggregated datasets. In addition to the WMO's stations, there are also civilian owned weather stations that inform platforms like Weather Underground, AcuRite, and Weather Bug. Unfortunately, those companies do not share the profits they generate off the data they collect from the community. Also, AcuRite no longer offers a public API for their users to easily access their own data. Even worse, WeatherBug has been caught selling private location data about its users to third parties.
Concerns for privacy and data ownership are on the rise. Though Facebook experienced moderate backlash for its role in the Cambridge Analytica scandal, many opine the reaction was insufficient. Switching costs remain high while data produced by users remains hosted on the platform's servers. One way to deal with this is to back up your own data in a secondary location such that it's available for personal use any time.
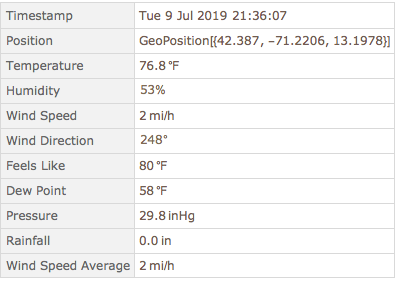
Insert your own myAcuRite login credentials into the code below and then evaluate the cell to obtain a table of the latest reading from your personal weather station. After the code retrieves the current data feed, it will be inserted into the Wolfram Blockchain and a public databin which can be accessed here. If the data is successfully inserted into the blockchain and recalled without changing the data, "True" will appear above the weather table. Note this also creates a Scheduled Task and Cloud Deploy to automatically retrieve your weather data once per hour. Also, feel free to create your own databin and replace the name with your own in the DatabinAdd[ ] line of code. Typical Output from a weather station is shown in the table above.
isoStringWithTZToDateObject[string_String]:=
(* by Jesse *)Module[{stringParts=StringSplit[string,RegularExpression["(?=((\\+|-)\\d{2}:\\d{2})|Z$)"]],tzpart,tzoffset,signedtzoffset},Which[Length[stringParts]===1,signedtzoffset=Automatic,ToUpperCase[stringParts[[2]]]==="Z",signedtzoffset=0,True,tzpart=StringSplit[stringParts[[2]],{RegularExpression["(?<=\\+|-)"],":"}];
tzoffset=NumberCompose[FromDigits/@Rest[tzpart],{1,1/60}];
signedtzoffset=N@If[tzpart[[1]]==="-",-tzoffset,tzoffset];];
DateObject[stringParts[[1]],TimeZone->signedtzoffset]];
(*frequency=15min;*)
frequency=Quantity[60,"Minutes"];
stask=ScheduledTask[Module[{
loginData,
mytoken,
myaccountid,
hubsData,
myhubid,
weatherfeed,
deviceRawData,
sensorRawData,
sensorUnits,
sensorData,
weatherEntry,
weatherHash,
list,
trxID
},
(*Send a login request with username and password to get a session token and account ID*)
loginData=URLExecute[HTTPRequest[<|
Method->"POST",
"Scheme"->"https",
"Domain"->"marapi.myacurite.com",
"Path"->"/users/login",
"ContentType"->"application/json",
"Body"->ExportString[
<|
"email"->"YourEmailHere",
"password"->"YourPasswordHere",
"remember"->"True"
|>,
"RawJSON"]
|>],"RawJSON"];

mytoken=loginData["token_id"];
myaccountid=loginData[["user","account_users",1,"account_id"]];

(*Find the ID of the particular weather station in question*)
hubsData=URLExecute[HTTPRequest[<|
 Method -> "GET",
"Scheme" -> "https",
"Domain" -> "marapi.myacurite.com/accounts/"<>ToString[myaccountid]<>"/dashboard/hubs","ContentType"->"application/json",
"Headers" -> {"x-one-vue-token" -> mytoken}
|>],"RawJSON"];
 myhubid=hubsData[["account_hubs",1,"id"]];

(*Obtain the current data feed from the particular weather station*)
weatherfeed=URLExecute[HTTPRequest[<|
Method -> "GET",
"Scheme" -> "https",
"Domain" -> "marapi.myacurite.com/accounts/"<>ToString[myaccountid]<>"/dashboard/hubs/"<>ToString[myhubid],
"ContentType"->"application/json",
"Headers" -> {"x-one-vue-token" -> mytoken}
|>],"RawJSON"];

(*Organize data. Consider cases with different units*)
deviceRawData=weatherfeed[["devices",1]];
sensorRawData=AssociationThread[deviceRawData[["sensors",All,"sensor_name"]]->deviceRawData[["sensors"]]];
sensorUnits=<|
"Temperature"->Switch[sensorRawData["Temperature","chart_unit"],"F","DegreesFahrenheit","C","DegreesCelsius"],
"Pressure"->Switch[sensorRawData["Pressure","chart_unit"],"inHg","InchesOfMercury","hPa","Hectopascals"],
"Humidity"->"Percent",
"Wind Speed"->Switch[sensorRawData["Wind Speed","chart_unit"],"mph","Miles"/"Hours","km/h","Kilometers"/"Hours","kn","Knots"],"Wind Direction"->"Degrees",
"Rainfall"->Switch[sensorRawData["Rainfall","chart_unit"],"in","Inches","mm","Millimeters"],
"Dew Point"->Switch[sensorRawData["Dew Point","chart_unit"],"F","DegreesFahrenheit","C","DegreesCelsius"],
"Feels Like"->Switch[sensorRawData["Feels Like","chart_unit"],"F","DegreesFahrenheit","C","DegreesCelsius"],
"Wind Speed Average"->Switch[sensorRawData["Wind Speed","chart_unit"],"mph","Miles"/"Hours","km/h","Kilometers"/"Hours","kn","Knots"]
|>;
sensorData=<|"Sensor"->#["sensor_name"],"Value"->Quantity[#["last_reading_value"],sensorUnits[#["sensor_name"]]]|>&/@Values@sensorRawData;


(*Include timestamp, latitude, longitude, and elevation into the table*)

weatherEntry=dataTable=<|
"Sensors"->sensorData,
"ReadingTimestamp"->TimeZoneConvert[isoStringWithTZToDateObject[deviceRawData["last_check_in_at"]]],
"SubmisisonTimestamp"->Now,
"Position"->GeoPosition[Append[
Interpreter["Real"][{weatherfeed["latitude"],weatherfeed["longitude"]}],
Quantity[weatherfeed["elevation"],Switch[weatherfeed["elevation_unit"],"ft","Feet","m","Meters"]]]]
|>;

(*Insert the weatherEntry and its hash into the Wolfram Blockchain and a Databin*)
previousHash=Hash[Normal[Databin["EM6FHeXi",-1]][[1,2]],"SHA256"];
list={previousHash, weatherEntry};
trxID=BlockchainPut[list];
listDB={previousHash, Hash[weatherEntry,"SHA256"],trxID};
DatabinAdd["EM6FHeXi",listDB];
],frequency];
task=SessionSubmit[Evaluate@stask];

obj=CloudDeploy[stask,"BlockchainWeatherUpdate"]
As seen in the code above and the image below, three entries are inserted into a databin. The first is a hash of the previous databin entry, the second is a hash of the current weather entry, and finally a receipt from inserting the weather entry into the Wolfram Blockchain. Use BlockchainGet[ ] with that receipt to retrieve the weather data for that entry. 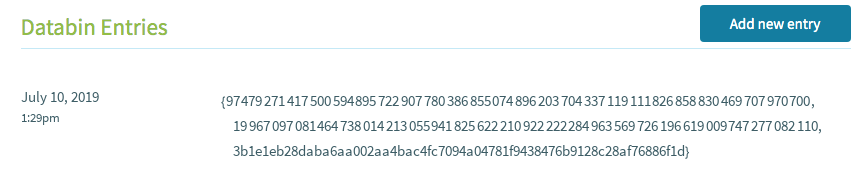
Where are additional weather stations needed?
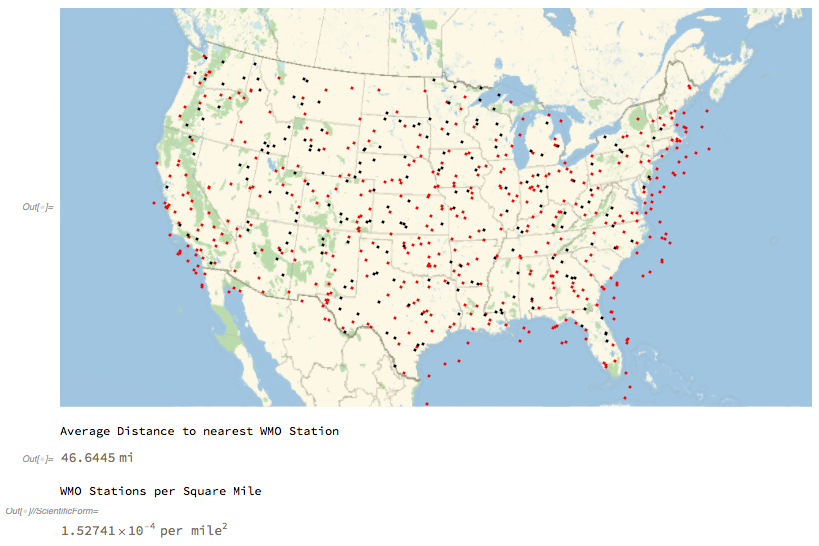
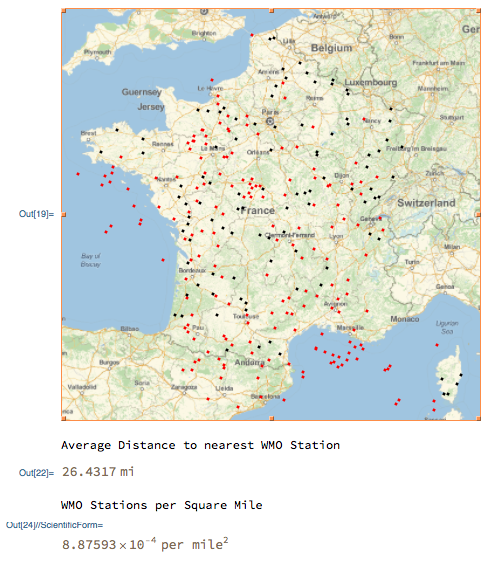
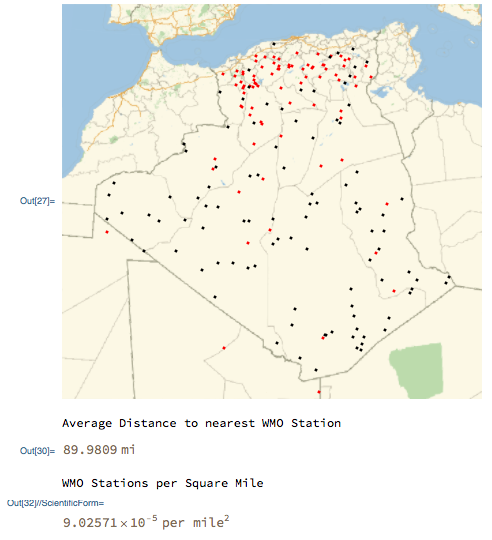
Data deserts in the field of meteorology exist in places like northern Canada, inland China, and North Africa. One of the largest factors contributing to weather forecasting inaccuracy is a lack of data from these areas. A typical World Meteorological Organization weather station costs several thousand dollars for a government to install. Deciding where to install new weather stations depends on several factors such as weather patterns, population centers, budgets, and accessibility. Though local governments may not have the budget to install an official WMO station, it is still important to collect data generated from local denizens.
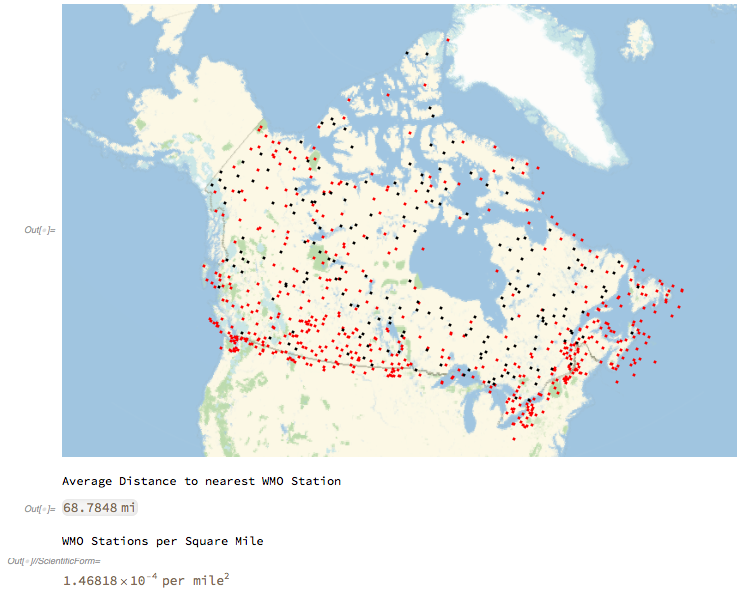
Use the cell below to import the dataset of WMO stations and plot random points in a variety of countries, then determine the average distance to the nearest WMO Station. As can be seen, the United States has a higher density of weather stations than Canada, while France has even more and Algeria has barely any.
WMOStations=ResourceObject["WMO Meteorological Stations"];
WMOLocations=Values@ResourceData["WMO Meteorological Stations"][Select[#Country==="United States"&], "Position"];
pts=RandomGeoPosition[Entity["Country","UnitedStates"],200];
GeoGraphics[{{Red,Point/@WMOLocations},{Black,Point[pts]}},GeoRange->Entity["Country","UnitedStates"]]
nearestDistances = GeoNearest[WMOLocations//Normal,pts[[1]]];
Print["Average Distance to nearest WMO Station"]
Mean[GeoDistance@@@Transpose[{nearestDistances[[All,1,1]],pts[[1]]}]]
Print["WMO Stations per Square Mile"]
ScientificForm[Length[WMOLocations]/EntityValue[Entity["Country","UnitedStates"],"Area"]]

WMOLocationsCA=Values@ResourceData["WMO Meteorological Stations"][Select[#Country==="Canada"&], "Position"];
ptsCA=RandomGeoPosition[\!\(\*
NamespaceBox["LinguisticAssistant",
DynamicModuleBox[{Typeset`query$$ = "Canada", Typeset`boxes$$ = TemplateBox[{"\"Canada\"", RowBox[{"Entity", "[", RowBox[{"\"Country\"", ",", "\"Canada\""}], "]"}], "\"Entity[\\\"Country\\\", \\\"Canada\\\"]\"", "\"country\""}, "Entity"], Typeset`allassumptions$$ = {}, Typeset`assumptions$$ = {}, Typeset`open$$ = {1, 2}, Typeset`querystate$$ = {"Online" -> True, "Allowed" -> True, "mparse.jsp" -> 0.549673`6.19164939839149, "Messages" -> {}}},
DynamicBox[ToBoxes[AlphaIntegration`LinguisticAssistantBoxes["", 4, Automatic, Dynamic[Typeset`query$$], Dynamic[Typeset`boxes$$], Dynamic[Typeset`allassumptions$$], Dynamic[Typeset`assumptions$$], Dynamic[Typeset`open$$], Dynamic[Typeset`querystate$$]], StandardForm],
ImageSizeCache->{125., {7., 15.}},
TrackedSymbols:>{Typeset`query$$, Typeset`boxes$$, Typeset`allassumptions$$, Typeset`assumptions$$, Typeset`open$$, Typeset`querystate$$}],
DynamicModuleValues:>{},
UndoTrackedVariables:>{Typeset`open$$}],
BaseStyle->{"Deploy"},
DeleteWithContents->True,
Editable->False,
SelectWithContents->True]\),200];
GeoGraphics[{{Red,Point/@WMOLocationsCA},{Black,Point[ptsCA]}},GeoRange->\!\(\*
NamespaceBox["LinguisticAssistant",
DynamicModuleBox[{Typeset`query$$ = "Canada", Typeset`boxes$$ = TemplateBox[{"\"Canada\"", RowBox[{"Entity", "[", RowBox[{"\"Country\"", ",", "\"Canada\""}], "]"}], "\"Entity[\\\"Country\\\", \\\"Canada\\\"]\"", "\"country\""}, "Entity"], Typeset`allassumptions$$ = {}, Typeset`assumptions$$ = {}, Typeset`open$$ = {1, 2}, Typeset`querystate$$ = {"Online" -> True, "Allowed" -> True, "mparse.jsp" -> 0.549673`6.19164939839149, "Messages" -> {}}},
DynamicBox[ToBoxes[AlphaIntegration`LinguisticAssistantBoxes["", 4, Automatic, Dynamic[Typeset`query$$], Dynamic[Typeset`boxes$$], Dynamic[Typeset`allassumptions$$], Dynamic[Typeset`assumptions$$], Dynamic[Typeset`open$$], Dynamic[Typeset`querystate$$]], StandardForm],
ImageSizeCache->{125., {7., 15.}},
TrackedSymbols:>{Typeset`query$$, Typeset`boxes$$, Typeset`allassumptions$$, Typeset`assumptions$$, Typeset`open$$, Typeset`querystate$$}],
DynamicModuleValues:>{},
UndoTrackedVariables:>{Typeset`open$$}],
BaseStyle->{"Deploy"},
DeleteWithContents->True,
Editable->False,
SelectWithContents->True]\)]
nearestDistancesCA = GeoNearest[WMOLocationsCA//Normal,ptsCA[[1]]];
Print["Average Distance to nearest WMO Station"]
Mean[GeoDistance@@@Transpose[{nearestDistancesCA[[All,1,1]],ptsCA[[1]]}]]
Print["WMO Stations per Square Mile"]
ScientificForm[Length[WMOLocationsCA]/EntityValue[Entity["Country","Canada"],"Area"]]

WMOLocationsAL=Values@ResourceData["WMO Meteorological Stations"][Select[#Country==="Algeria"&], "Position"];
ptsAL=RandomGeoPosition[Entity["Country","Algeria"],100];
GeoGraphics[{{Red,Point/@WMOLocationsAL},{Black,Point[ptsAL]}},GeoRange->Entity["Country","Algeria"]]
nearestDistancesAL = GeoNearest[WMOLocationsAL//Normal,ptsAL[[1]]];
Print["Average Distance to nearest WMO Station"]
Mean[GeoDistance@@@Transpose[{nearestDistancesAL[[All,1,1]],ptsAL[[1]]}]]
Print["WMO Stations per Square Mile"]
ScientificForm[Length[WMOLocationsAL]/EntityValue[Entity["Country","Algeria"],"Area"]]

WMOLocationsFR=Values@ResourceData["WMO Meteorological Stations"][Select[#Country==="France"&], "Position"];
ptsFR=RandomGeoPosition[Entity["Country","France"],100];
GeoGraphics[{{Red,Point/@WMOLocationsFR},{Black,Point[ptsFR]}},GeoRange->Entity["Country","France"]]
nearestDistancesFR = GeoNearest[WMOLocationsFR//Normal,ptsFR[[1]]];
Print["Average Distance to nearest WMO Station"]
Mean[GeoDistance@@@Transpose[{nearestDistancesFR[[All,1,1]],ptsFR[[1]]}]]
Print["WMO Stations per Square Mile"]
ScientificForm[Length[WMOLocationsFR]/EntityValue[Entity["Country","France"],"Area"]]
Retrieving and Charting Data from the Blockchain
This cell retrieves entries from the blockchain and charts them against a local weather station. In this example, data is retrieved from KBED which is located at the Laurence G Hanscom Field Airport about ten miles away from the personal weather station. The difference in temperature readings could be attributed to a micro-climates created my paved runways, buildings, HVAC, or other interferences. Though, in general, the temperature reading from KBED takes longer to cool down and longer to heat up. Curiously, KBED's pressure sensor either seems to be broken or has far less granularity than an AcuRite PRO+ 5-in-1 Weather Sensor.
(*Collect all the Blockchain sumbissions from the weather station and chart the temperature over time*)
Databin["EM6FHeXi", All];
recentHashes=Normal[Dataset[Databin["EM6FHeXi", -24]]][[All,1,-1]];
data=Dataset[BlockchainGet[recentHashes]];
times=data[[1;;All,2,2]]//Normal;
temps=data[[1;;All,2,1,1,2]]//Normal;
myTempsTimeSeries=TimeSeries[Transpose[{times, MapAt[ToExpression,#,1]&/@temps}]];
wmoTempsTimeSeries=TimeSeries[Transpose[{times, AirTemperatureData["KBED", times]}]];
DateListPlot[{myTempsTimeSeries,wmoTempsTimeSeries},
    PlotLegends->{"Personal Weather Station","Nearest ICAO Station"}]

(*Chart the weather station's Pressure*)
pressure=data[[1;;All,2,1,7,2]]//Normal;

myPressureTimeSeries=TimeSeries[Transpose[{times, MapAt[ToExpression,#,1]&/@pressure}]];
wmoPressureTimeSeries=TimeSeries[Transpose[{times, AirPressureData["KBED", times]}]];
DateListPlot[{myPressureTimeSeries,wmoPressureTimeSeries}, PlotLegends->{"Personal Weather Station","Nearest WMO Station"}]

(*Chart the weather station's Wind Speed*)
windSpeed=data[[1;;All,2,1,3,2]]//Normal;
myWindTimeSeries=TimeSeries[Transpose[{times, MapAt[ToExpression,#,1]&/@windSpeed}]];
wmoWindTimeSeries=TimeSeries[Transpose[{times, WindSpeedData["KBED", times]}]];
DateListPlot[{myWindTimeSeries, wmoWindTimeSeries},
    PlotLegends->{"Personal Weather Station","Nearest ICAO Station"}]
Air Temperature 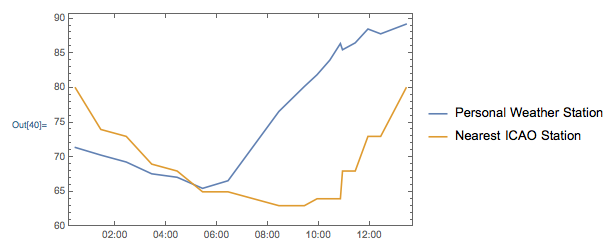 Pressure
 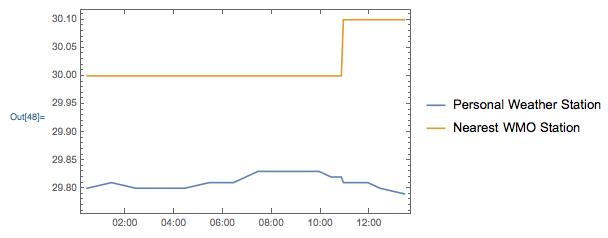 Wind Speed
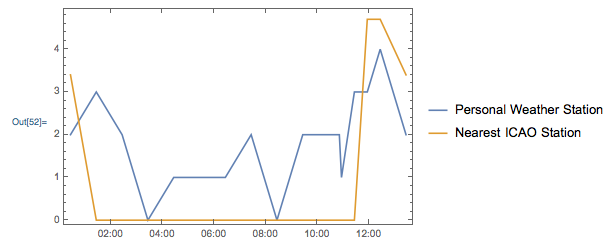
Future Ambitions
Future work includes plotting additional weather stations hosted by ICAO and CWOP. Plotting these datasets along with WMO stations will help determine the geographic areas with the least density of weather stations - where it would make the most sense to install the next weather station. Next steps also include:
recording multiple personal weather stations into a blockchain and databin such that each contributor gets credit for their contributions
computing weather forecasts augmented with the collected data
inserting data entries into other blockchains such as Ark and Ethereum
Notebook URL


