Disclaimer
A notebook and a package with all functions used and more detailed explanations are available at this link: GitHub
Goal
This project's goal is to find the most frequently-used-functions with another given function. For example, in the documentation for the function Plot, the function Sin appears a lot as argument, thus this could be the most frequently used function with Plot. One of the objective of such a project would be to make suggestions to the user while he writes his code, or to improve the documentation with a "Frequently used" tab.
Implementation
To implement such a thing, lot of data is needed to obtain fairly accurate results. That's where the documentation comes handy, it's possible to retrieve all examples inputs and thus generate data to analyze.
Parsing the documentation
Using the very useful WolframLanguageData function, it is very easy to parse examples for later analysis. Woefully, the documenation inputs are using the typesetting format so a little conversion needs to be done.
DPConvertDoc[doc_List] := Check [(doc // ToBoxes // MakeExpression) /. ExpressionCell[a_, __] :> a, $Failed]
Basically, the parser is converting the typesetting boxes into an evaluating expression that will be processed afterwards.
Gathering data
Using the parser, almost all example inputs were converted. To actually get some useful informations from the examples, another "parsing" needs to be done.
A first approach
The first approach is fairly simple and naive, it consists of counting each functions that appear in the documentation examples for a given function and weighting down those who appear everywhere else while also removing "useless" symbols. Counting them is pretty easy, and we get this kind of result for Plot in the documentation:
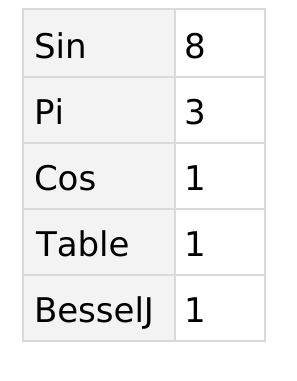
Now, to weight things, we make a graph out of all counts using AdjacencyGraph to see links between all functions. This way, the VertexDegree of each "function" will represent how much it appears. To actually weight down those with a high degree, we can use (Max[x] + 1) / (x + 1), where x is the list of vertex degrees. It is a pretty aggresive weighting, but as we take any function that appears, those who are rarer will have a higher chance of actually be related to the function we are evaluating.
As for example with Probability we have a fairly decent result, but we still have some "bloat" and functions that are not at all related.
A second approach
In the second approach, we are trying to fix the problem of the first approach where even unrelated functions are taken into account. To do this, we can simply only count functions that are arguments of the head. This way, we are sure that they are related.
To make this possible, we need to extract the positions of each symbol and find their relationship. Hopefully, Position exactly does that. It gives the level of each symbol and thus we can find the relations using the level at which they are. For example:
    expr = HoldComplete[Plot[{Sin[x], Sin[2 x], Sin[3 x]}, {x, 0, 2 Pi}, PlotLegends -> "Expressions"]];
    {{1, 0}, {1, 1, 0}, {1, 1, 1, 0}, {1, 1, 2, 0}, {1, 1, 2, 1, 0}, {1, 1, 3, 0}, {1, 1, 3, 1, 0}, {1, 2, 0}, {1, 2, 3, 0}, {1, 2, 3, 2}, {1, 3, 0}, {1, 3, 1}}
Using some pattern matching we easily find heads and arguments.
    FAFindHeads[treePos_] := Cases[treePos, {___, 0}]
    FAFindChildren[{parent___, 0}, treePos_] := Cases[treePos, {parent, Except[0]} | {parent, Except[0], 0}]
Now, using Extract we get the name of each functions and we can count them using a big association. After gathering data using these functions we can do the same analysis as the first approach, meaning we compute a graph and weight each function.
The only difference is the weighting formula used, as we are taking only functions that are arguments we have way less bloat so the formula doesn't need to be too aggressive as it would gives too much weight to rarely used functions. The formula used is 1 / Log[x] + 1, it gives a pretty smooth curve which is ideal.
After applying the weights:
 We can now see that only actual functions that can be used as argument are present, which is a great thing to make suggestions while writing code.
Conclusion
Each of these two approaches have their pros and cons, the first approach can pick up related functions but will be biased by the documentation examples which does not represent real scenarios. As for the second approach, the fact that it can run on any input allows for it being adapted to any user codebase. The second approach also only takes into accounts function that are used as arguments of other functions, which can be a great thing for autocompletion but limited when looking for a broader "Related functions" option.
A good example of that is the Probability function, in the first approach, some Distribution functions appear and they are indeed related, but Plot3D also appears which is not really specially used for it.


