1. Preamble
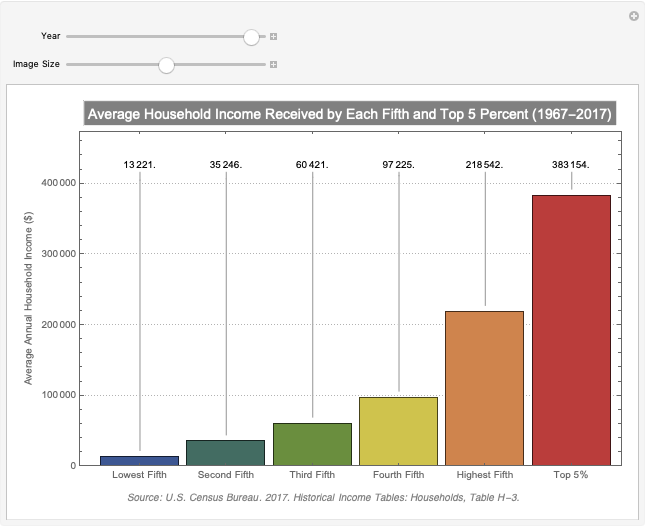
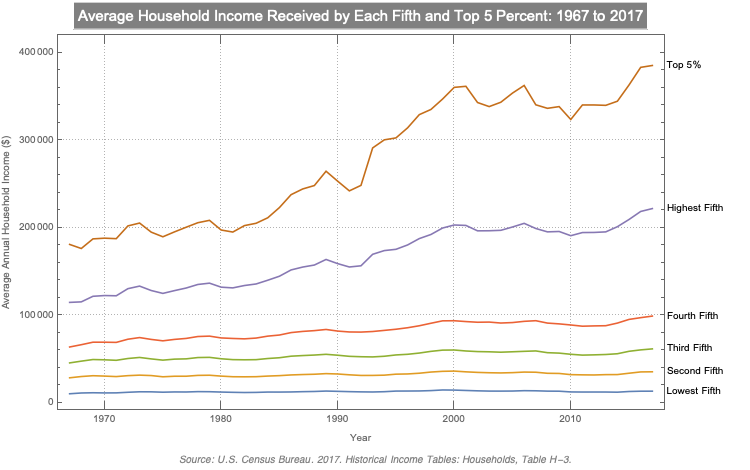
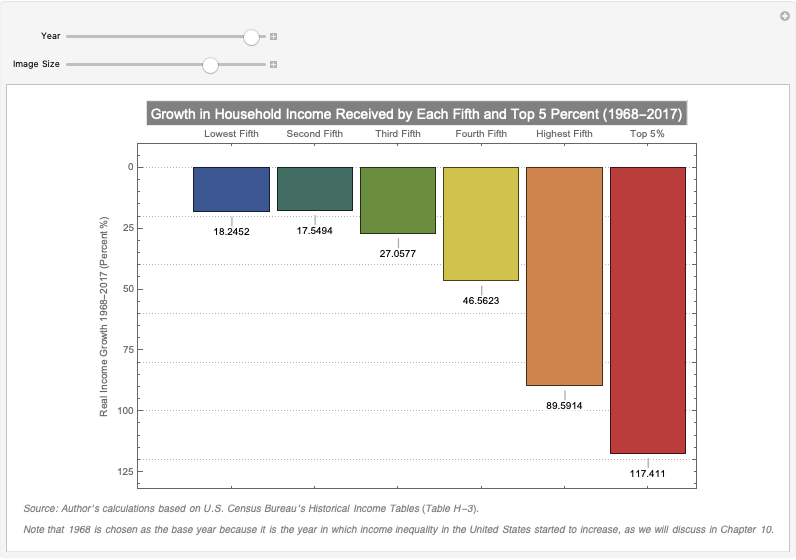
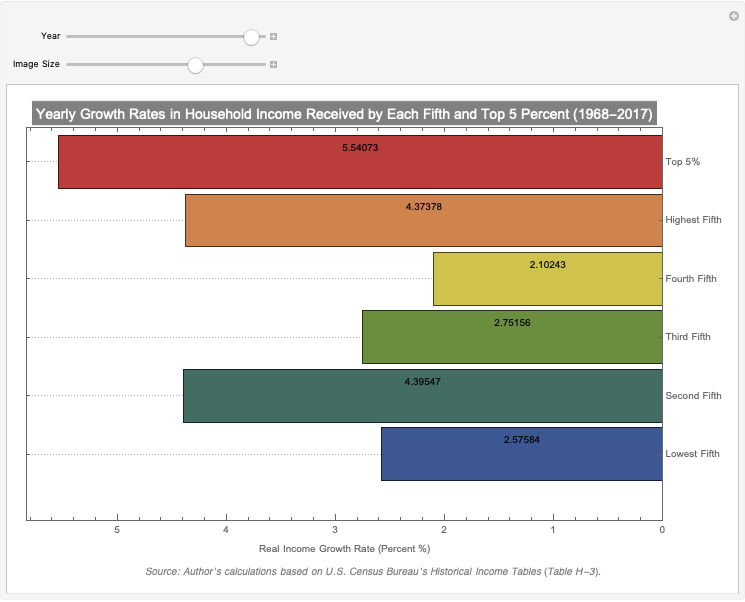
You've probably heard the saying that "The poor get poorer and the rich get richer." Using Wolfram Language a little and modest attempt is made to open door for further and deeper valiant investigations with the Wolfram Language (WL) on "to what extent this saying is true" and to shed light on its implications for social welfare and social conflict by showing how revolutionary WL is in providing a full spectrum of data analysis, including real-time data analysis and management and from getting and exploring data to building high-quality models and visualizations, generating rich interactive reports, and deducing consequences. For this particular purpose, this computational essay uses U.S Census Historical Income Tables, more specifically the tables that show average household income for different income groups in the United States which will available very soon at the Wolfram Data Repository that is Wolfram's public data resource which hosts an expanding collection of computable datasets of many types suitable for immediate use in computation, visualization, analysis and more.
2. Data and Findings
The following codes imports the Historical Income Tables and transform them into a form which makes it possible to build high-quality visualizations and generate rich interactive reports.
    Data = Import[
       "/Users/Proqrustes/Desktop/WSS/Data/1_IncomeDistribution.xls"];
    table = KeyMap[
       Replace[{n_?NumberQ :> DateObject[{Round[n]}],
         s_String :> DateObject[{ToExpression[StringTake[s, 4]]}]}],
       First /@ GroupBy[Data[[1, 60 ;; 111]], First -> Rest]];
    cleanedData =
     AssociationThread[{"Lowest Fifth", "Second Fifth", "Third Fifth",
       "Fourth Fifth", "Highest Fifth", "Top 5%"},
      TimeSeries@
         AssociationThread[Keys[table],
          Quantity[#,
             DatedUnit["USDollars", DateObject[{2017}]]] & /@ #] & /@
       Transpose@Values[table]];
WL's Manipulate command, which is designed to be used by anyone who is comfortable using basic commands such as Table and Plot, lets us create an astonishing range of interactive visual demonstrations of the data with just a few lines of input, which can be found here, as shown below: