Project Definition
Finding information in archives of chemistry manuscripts or patents requires the ability to recognize the printed diagrams of chemical structures. This project explores the translation of a chemical diagram to its chemical graph representation in the Wolfram Language.
Process
I decided to use classical image processing techniques to avoid having to curate a data set for any machine-learning-based approaches. There are two main phases, which involve detecting lines and grouping vertices.
Line detection and filtering
The first step involves the following:
- detecting lines
- grouping parallel and nearby lines
- merging intersecting lines
I used the built-in function ImageLines, and to ensure that no lines were missed at the early stage, I used relatively lenient parameters for the threshold $t$ and the distinctness $d$. I tested the line detection with different combinations of these parameters. Note that ImageLines detects light lines on a dark background, so the image of the structure is negated. The basic format is:
lines=ImageLines[ColorNegate[image], t, d, Method->{"Segmented" -> True}]
To account for additional detected lines, I grouped lines that were parallel and nearby into lists, reasoning that adjacent bonds are usually separated by angles for readability.
To find parallel lines, I found the acute angle of the line, treated as a vector. I used a tolerance of 10 degrees as my measure of "parallel".
lineAngle[Line[p_?MatrixQ]]:=
  Block[{ps},
  ps=Sort[p];
  ArcTan[ps[[2,1]]-ps[[1,1]],ps[[2,2]]-ps[[1,2]]]
]

Gather[Sort[longLines],
  Not[degreeTolerance < Abs[lineAngle[#1]/Degree - lineAngle[#2]/Degree] < (180 - degreeTolerance)] &];
This figure enumerates the detected groups of parallel lines. 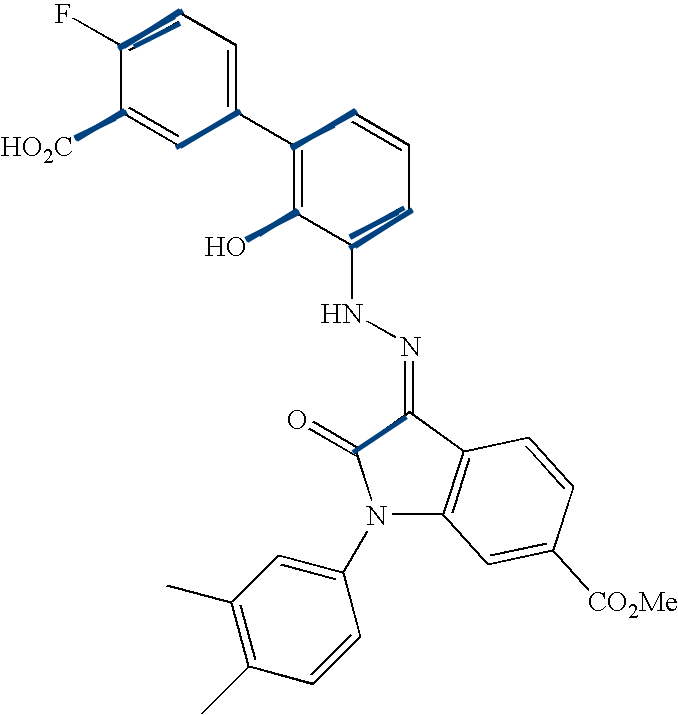
The parallel line grouping method could be updated in the future by looking at the distribution of the line angles. 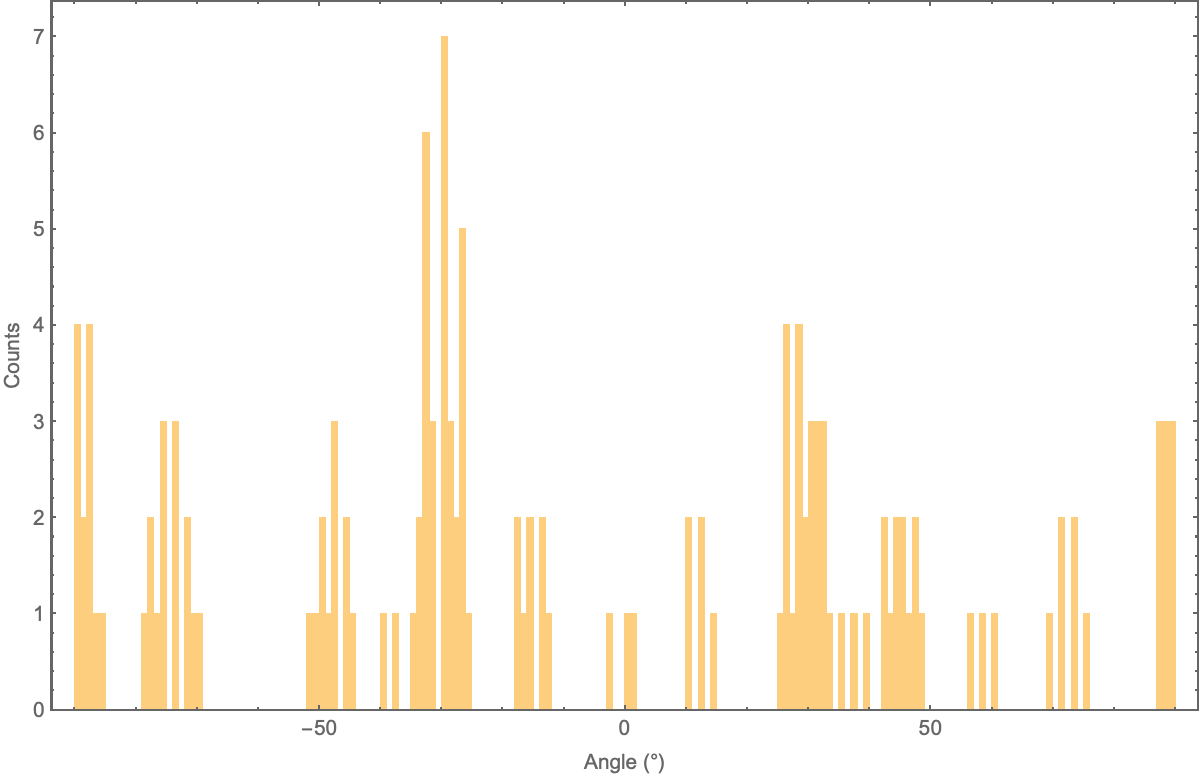
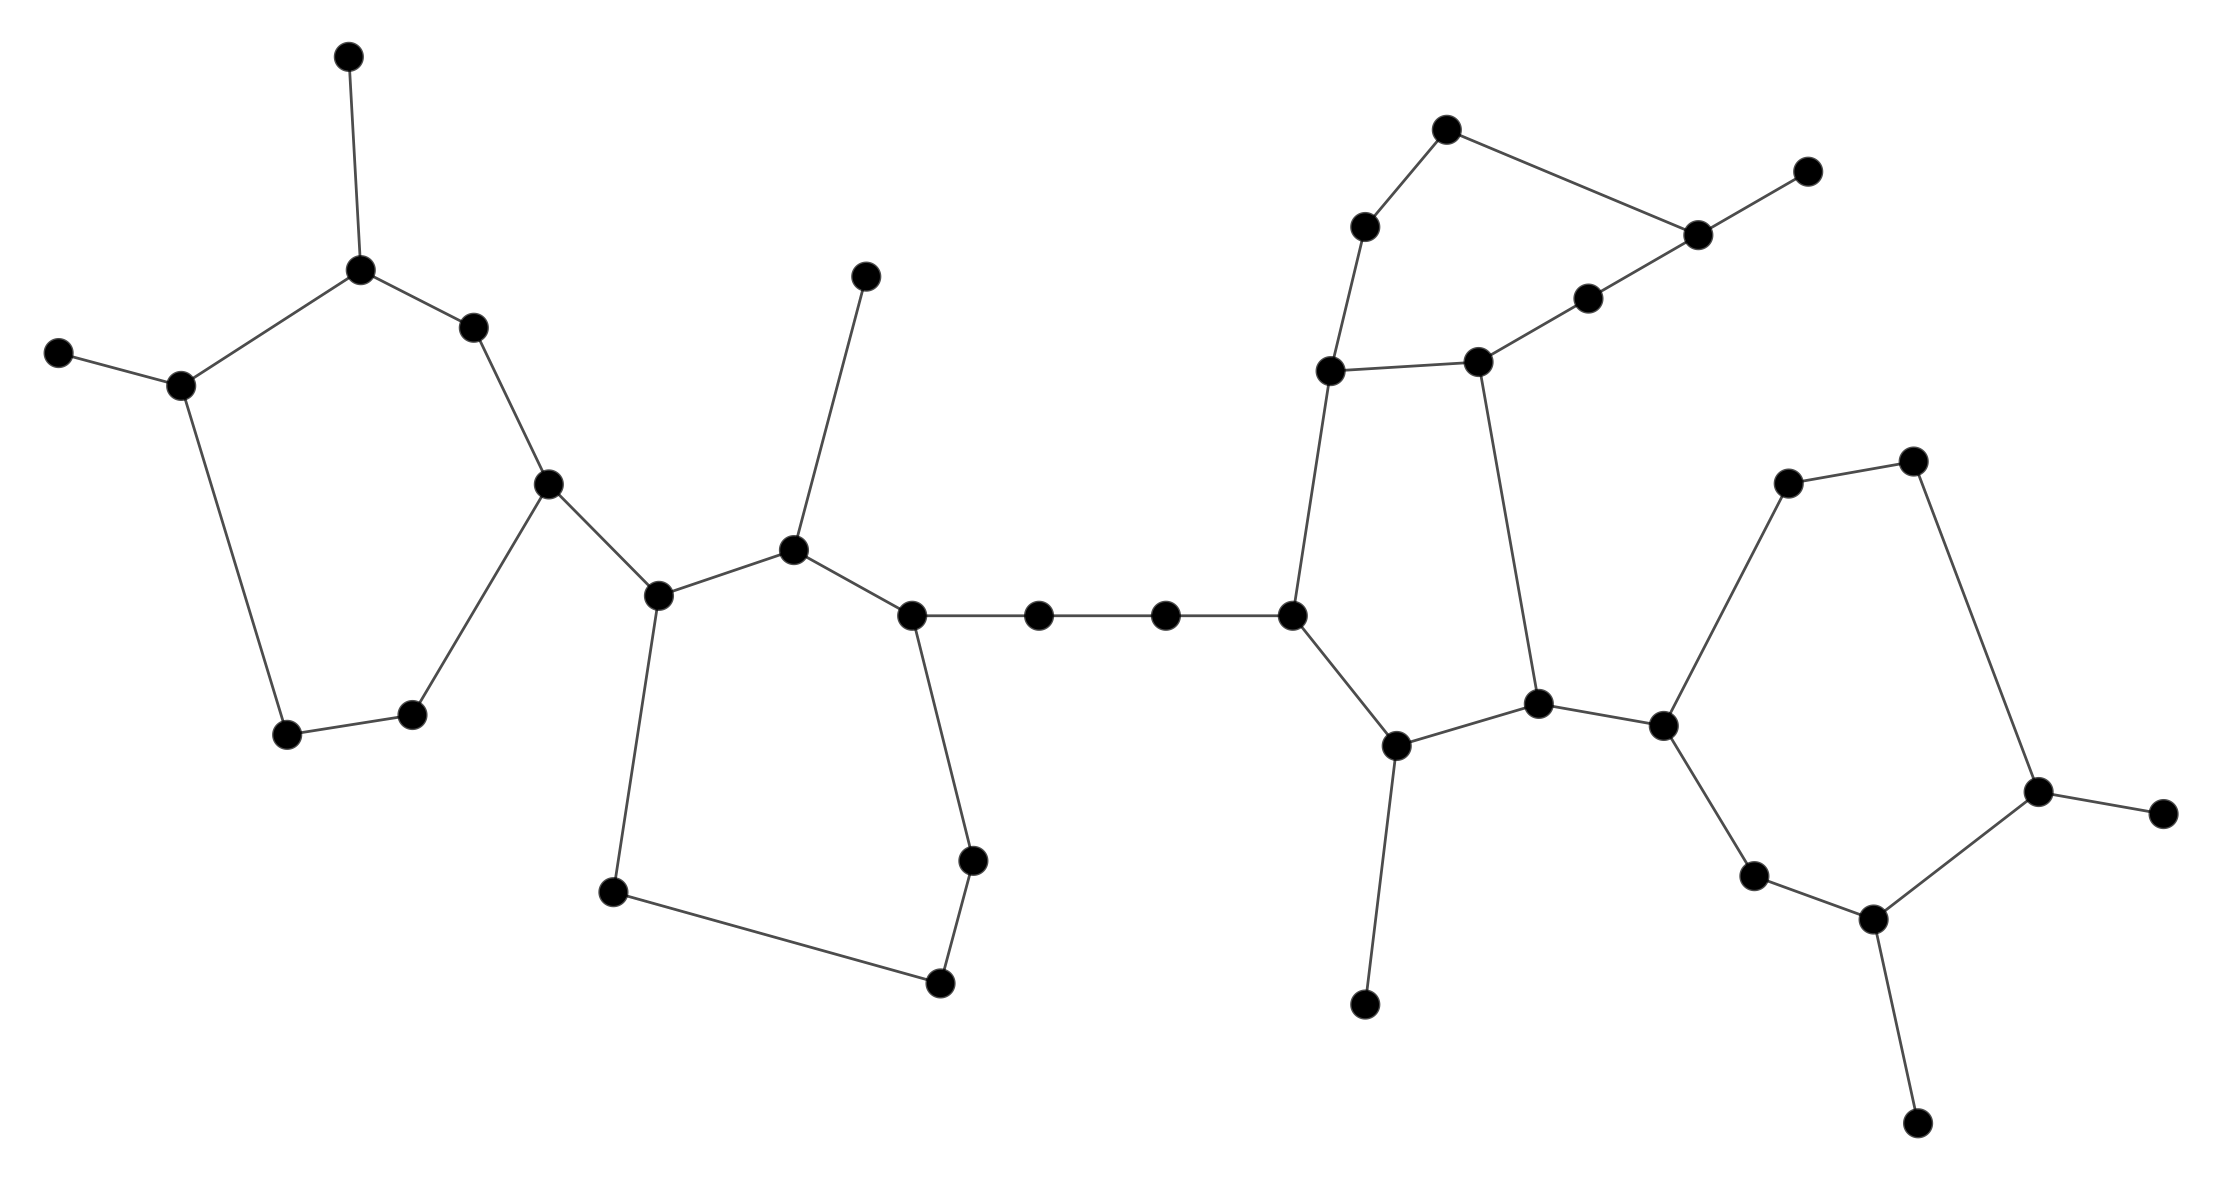
After grouping the parallel lines further by nearby lines, I used a brute-force approach to find intersections. I represent intersecting lines as a list of lists containing pairs of intersecting lines. I then merged sets of identified intersecting lines by creating a line with the endpoints with the greatest distance between them. The cleaned-up lines were ready for creating the graph.
Constructing the graph
I obtain the graph representation of the molecule by:
- finding atom positions
- building the graph edge list by tracing vertices
I locate atom positions (vertices) by merging the endpoints of the cleaned-up lines.
Gather[cleanPoints, EuclideanDistance[#1, #2] < mergeThreshold &]
This graphic shows the result of the endpoint merge with a progressively larger threshold. 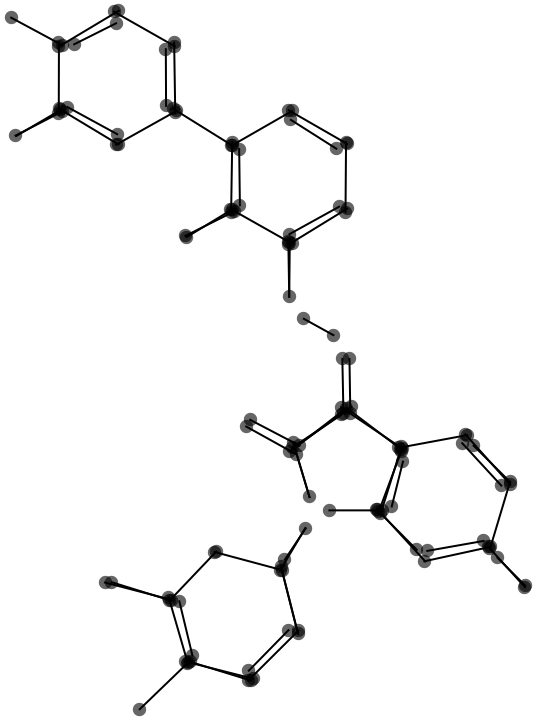
The graph is built by tracing each atom vertex to each neighbor, using the list of lines as the bridge between them. Here, mergedPointParents is an association to look up the line endpoint from each merged vertex, and separatePointsChild is an association to go back from an endpoint to atom vertex. The function traceConnections is described in the Notes.
edgeListTargets = Map[traceConnections[#, cleanLines, mergedPoints, mergedPointParents, separatePointsChild] &, mergedPoints]
edgePairs = Thread /@ Transpose[{Range[Length[edgeListTargets]], edgeListTargets}]
edgeList = Flatten@Map[UndirectedEdge @@ # &, edgePairs, {2}];
After removing loops and duplicate entries, the following graph results.
Chemical Representation
The Wolfram Language has the function Molecule to find a molecule given a list of atoms and list of bonds. For example,
Molecule[{"N", "C", "Br", "Cl", "C"}, {Bond[{1, 2}, "Single"],
Bond[{2, 3}, "Single"], Bond[{2, 4}, "Single"],
Bond[{2, 5}, "Single"]}]
I did not complete the identification of the atoms but could create a "molecule" of just carbon and hydrogen.
The edge list is converted into a list of bonds:
noDuplicateEdgePairs = DeleteDuplicates[Sort /@ Flatten[edgePairs, 1]];
noSelfBond = DeleteCases[noDuplicateEdgePairs, {i_, i_}]
bondList = Apply[Bond@*List, noSelfBond, 2];
This list of bonds is ready for processing by Molecule.
Next Steps
Certain parameters require generalization to allow for molecules printed at different sizes. For long line detection and parallel line grouping, the thresholds could be set based on the distribution of detected lengths and angles in the image. For the merge radius, the optimal point could be found by trying multiple merge radii and finding a plateau in the number of identified vertices.
To associate text-recognized symbols with vertices, the function MorphologicalComponents can be explored for feature extraction, followed by filtering out the non-text using the previously-identified lines.
The location of the recognized text could be mapped to the locations of identified vertices. Then, the molecule would be created with the existing syntax:
Molecule[atomList, bondList]
Finally, the code could be deployed to the WolframCloud to allow anyone to upload a structure for processing.
Notes
Data Source
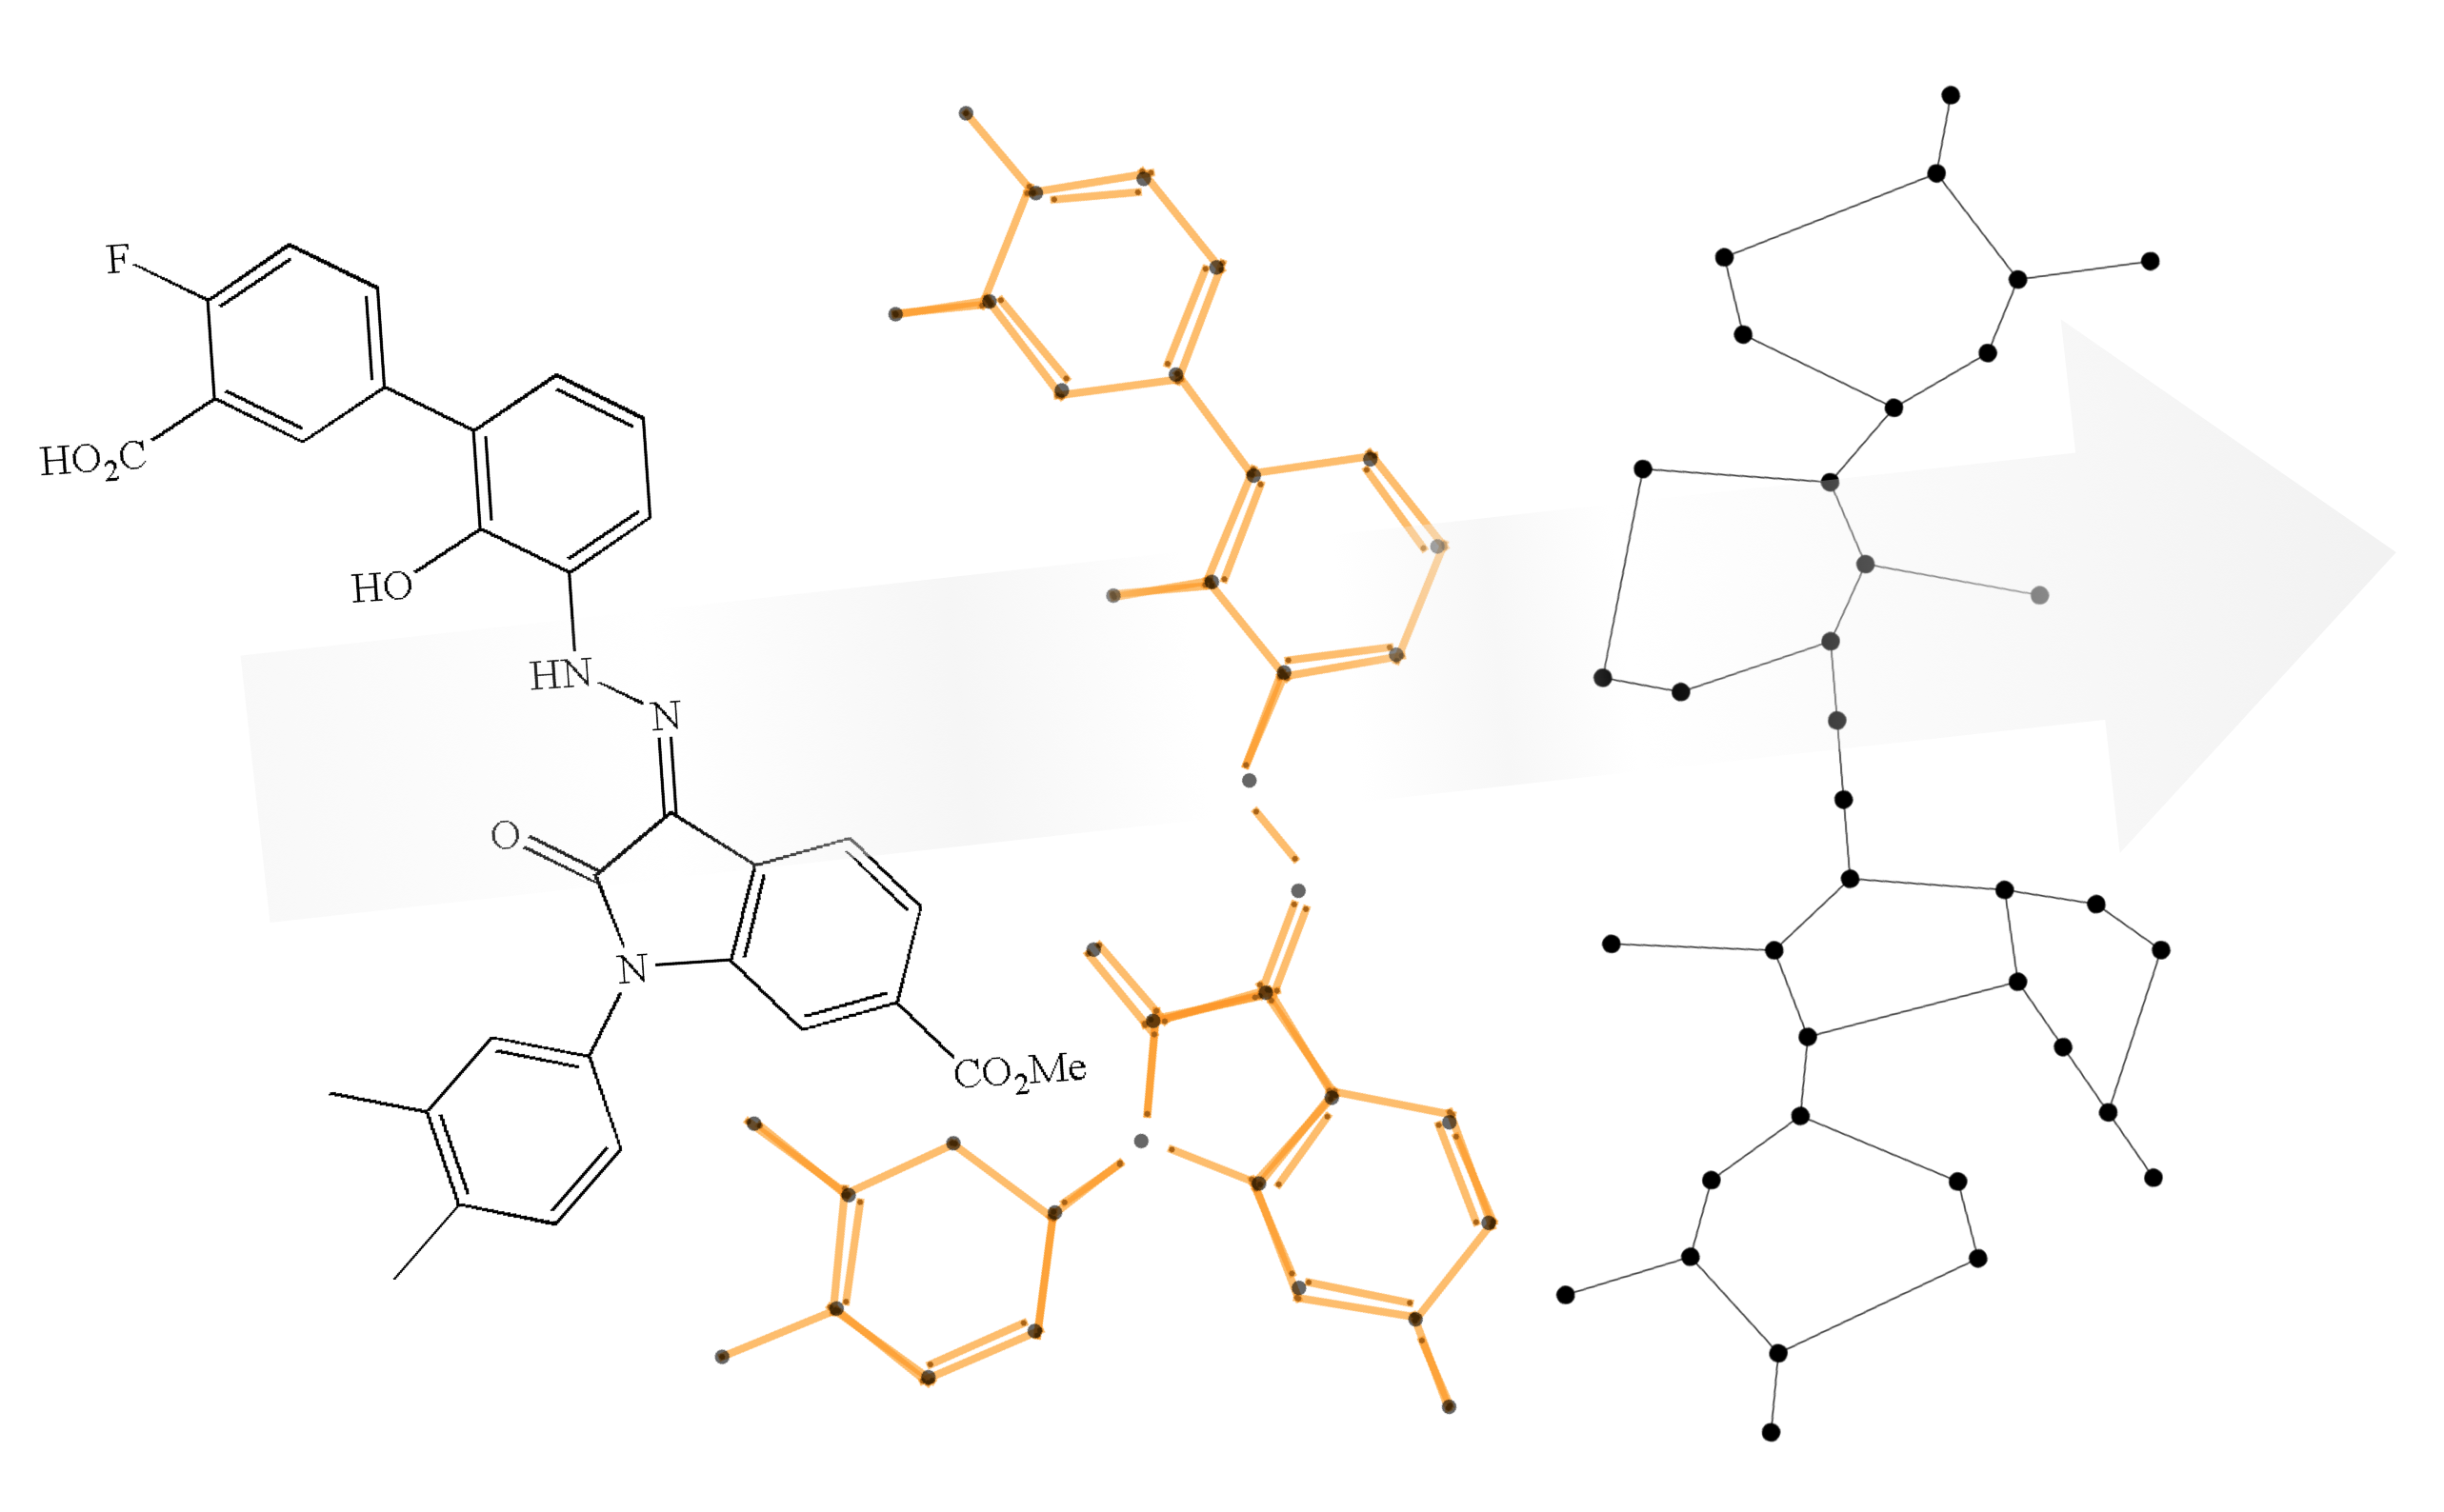
I used the images from the [open source project OSRA]6 (Optical Structure Recognition Application, from the NIH).
Additional Code
To collect intersecting lines, the function gatherIntersectingLines uses a brute-force (limited time to implement) approach by checking all line pairs in the set for intersections.
gatherIntersectingLines[lines : {Repeated[Line[_?MatrixQ], {2, Infinity}]}] :=
Block[{subsets, s2, s3, s4, intersect1, notIntersecting},
   subsets = Subsets[lines, {2}];
   intersect1 = GroupBy[subsets, lineIntersectQ];
   If[
     KeyExistsQ[intersect1, False]
     , notIntersecting =  Complement[Flatten@intersect1[False], Flatten@Lookup[intersect1, True, {}]];
     , notIntersecting = {};
     ];

   s2 = Lookup[intersect1, True, {}];

   s3 = Gather[s2, IntersectingQ[Part[#1], Part[#2]] &];

   If[Dimensions[s3] == {0}
     , s4 = {Map[{#} &, notIntersecting]};
     , s4 = Join[s3, {Map[{#} &, notIntersecting]}, 2];
    ];

 Return[s4]
 ]
The essence of the mergeLines function is here. It finds the pair of endpoints with the greatest distance between them.
mergeLines[lines:{Repeated[Line[_?MatrixQ],{2,Infinity}]}]:=
  Block[{pts,subs,bigLine},
  pts=Flatten[First/@lines,1];
  subs=Subsets[pts,{2}];
  bigLine=MaximalBy[subs,Apply[EuclideanDistance]];
  Return[Apply[Line,bigLine]];
]
The traceConnections function follows each merged atom vertex to the part of its endpoint in the expression containing the list of lines. The part of the other endpoint is then passed to another association to find the linking atom vertex to build up the list of connections.
traceConnections[p_Point,lineGroup:{Repeated[Line[_?MatrixQ],{2,Infinity}]},pointGroup:{Repeated[_Point,{1,Infinity}]},mergedParents_Association,vertexChildren_Association]:=
Block[{pQP,pointIndex,otherPointIndex,otherPoints,otherMergedPoint,connectingIndices},
  pQP=mergedParents[p];
  pointIndex=Map[Position[lineGroup,#]&,pQP[[;;,1]]];
  otherPointIndex=Map[ReplacePart[#,{1,-1}->Mod[#,2]+1&@#[[1,-1]]]&,pointIndex,1];
  otherPoints=Flatten@Map[Point@Part[lineGroup,Sequence@@Flatten@#]&,otherPointIndex,{2}];
  otherMergedPoint=vertexChildren/@otherPoints;
  connectingIndices=Position[pointGroup,#]&/@Flatten@otherMergedPoint;
  Return[Flatten@connectingIndices]
]
The project code can be found on the GitHub repository: https://github.com/kerrcb/wss19-ck/tree/master/Final%20Project/Final%20Submission


