Introduction
In this study, we learn how to predict the winner of a basketball game. This prediction is a valuable resource to make confident bets. It is also interesting to know which factors are most correlated with team success. This type of analysis can help teams to win more games. Generally, a good performance rate is seen as anywhere between 60-70%. Below are a few noteworthy companies with their accuracies across various NBA seasons.
- FiveThirtyEight correctly predicted the winner of 66.42% of games during the 2017-2018 NBA season.
- NBA Miner correctly predicted the winner of 65.3% of games during the 2015-16 NBA season.
In this study, we show that we can reach this level of prediction accuracy with just a few statistics.
Plan
There are many factors in an NBA game to consider from internal factors such as points, shots, rebounds, assists, passes, blocks, steals etc to external factors such as distance traveled to a game, elevation, home or road games, back to back games etc. For this study, there were three groups of statistics that were considered
Rating System for each team. The issue with using W-L record or winning percentage is that it does not take into account the skill of the opponent. The Elo rating - a rating to measure the relative skill level of a team - accounts for this problem.
Internal factors. These are in game statistics such as points, rebounds, assists etc.
- External factors. These are factors that occur outside of the game itself. These include injured players, back to back games and players resting. In this study, we use the location i.e. who is home and who is away.
The following statistics were used in this project:
- Elo rating
- Location
- Assists - moving average
- Rebounds - moving average
- Points scored - moving average
- Free throw Makes - moving average
The training set was created by collecting these statistics for all games between and including the 2008-09 and the 2017-18 seasons - 12,060 games. We extracted the aforementioned statistics and associated them with either a "win" or a "loss." The goal is to predict the winner and loser of each game of the 2018-19 season. We tackle this classification task with machine learning.
The first step was to import the data. All desired stats were then extracted and stored in an association.
Description of the features
Elo
The most common statistic to use to measure a team's skill level is their W-L record (or winning percentage). This is problematic for two reasons. First, the winning percentage does not take into account the skill levels of the teams played. Therefore, if team A is 9-1 and team B is 7-3, this does not necessarily mean that team A is more skilled: team A may have faced less skilled competition. Second, the W-L record gives each game equal weight. If team A defeats a highly skilled team, they deserve more "points" than if they defeated a pedestrian team.
Elo accounts for both of these issues. Elo is a rating system in which every team starts at an average level - a score of 1500. Points are "exchanged" every game. The winning team receives points from the losing team proportional to their percentage chance of winning. The percentage chance of winning - pwin, is:
In[]:= Pwin[Elo1_, Elo2_] := 1/(1 + Power[10., -(Elo1 - Elo2)/400])
For example, if team A has an Elo of 1550 (above average) and team B has an Elo of 1450 (below average), then the chance of team A winning is:
In[]:= Pwin[1550, 1450]

Out[]= 0.640065
If team A were to win, they would receive
In[]:= delta = 20*(1 - Pwin[1550, 1450])

Out[]= 7.1987
But, if team B were to win, they would receive
In[]:= delta = 20*(1 - Pwin[1450, 1550])

Out[]= 12.8013
This calculation is completed for each game and stored in a list.
Home/Away (Location)
Teams that play at home are more likely to win games, making this an important factor. A team with a lower Elo rating may defeat more skilled teams due to this.
The games first need to be organized in chronological order. To do this, the dates of each game are collected and then sorted properly. Then, the games are matched up to the appropriate dates.
In this data set, there are two records for each game: team A @ team B and team B vs. team A. We only need the information for one of the games, therefore we need to delete half the data set to prevent duplicate games from occurring.
Rebounds
A rebound is collecting the basketball after it has bounced off the rim or backboard. The ability to accrue rebounds at a higher rate than the opposing team lends itself to more scoring opportunities. The more possessions a team has, the likelier they should be to win. The first step, is to make a list for each team with all of their respective rebounds for the season. After this, the moving average is calculated.
Since the NBA games will appear in chronological order, we need to create a function that will read the teams playing and properly insert that team's moving average. The assists, free throws, and points per game were calculated in the same fashion.
Assists
An assist is rewarded when a player passes the basketball to a teammate and that teammate scores shortly after. Passing the basketball many times forces the defense to constantly move around and opens the possibility of a defensive error and a high percentage shot attempt. Therefore, if a team has many assists, they should be more likely to win.
Made Free Throws (FT)
Free throws are typically attempted after a player is fouled. If a player makes a free throw, their team is rewarded a point. Free throws are the easiest shot attempts in basketball since there is no defender guarding the player. A team that averages more made free throws in a game may be more likely to win games.
Points Per Game (PPG)
Since the team that scores the most wins, a team being able to average a lot of points will be more likely to win games
Approach: Classification Method
We isolate the data for the 2018-19 NBA season to evaluate the performance (validation set). We use the previous seasons to train the classifier. The number of seasons that we take ranges from 1 to 10.
Experimental Results
Which statistics are most relevant to predict the winner?
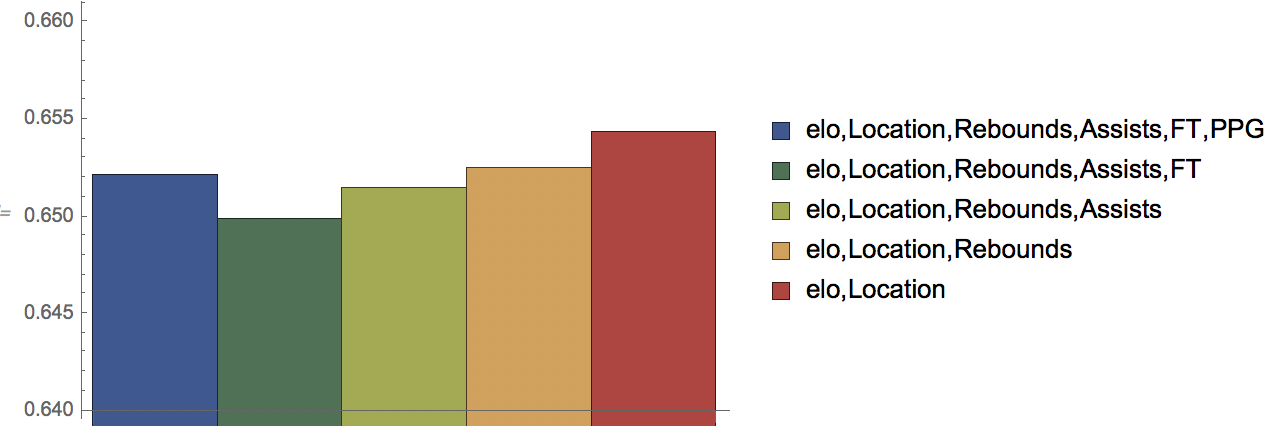 The most accurate prediction of all of these options was actually the one with the least amount of variables - Elo and location.
The average performance was:
In[]:= averageFactor[eloLocation]

Out[]= 0.654358
This indicates that Elo and location are the most important statistics in predicting the winner of a game.
In order to discover which statistics are most important, each statistic was isolated, trained, and then the 2018-19 NBA season was predicted with the following results: 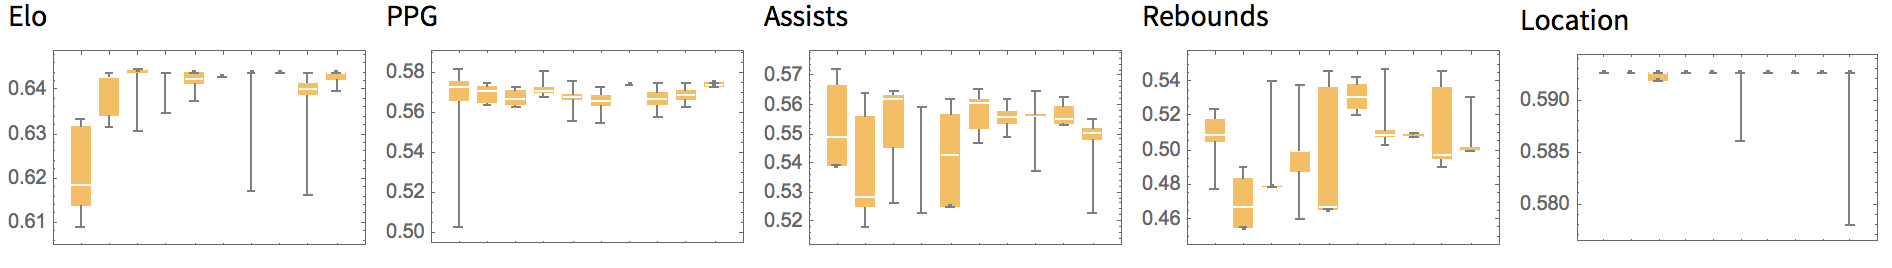 Collecting the average values from each of the charts, we get:
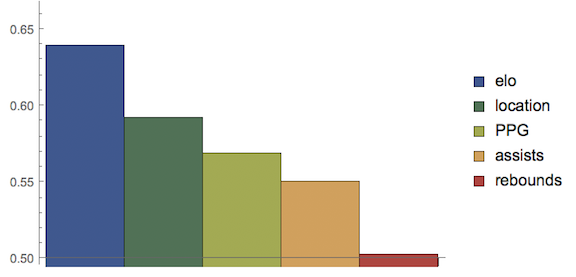
Elo is the most important factor, followed by location. PPG and assists are lesser factors, but likely do not improve the performance as they are a function of the Elo rating i.e. better teams score more points and accrue more assists. Rebounds and FT are not significant factors.
How many seasons are needed to reach the best prediction?
The following figures show the prediction accuracy with respect to the number of seasons used to train, for the best set of features. In order to be able to judge if differences are significant or not, we use box whisker charts with sets of train/test runs.
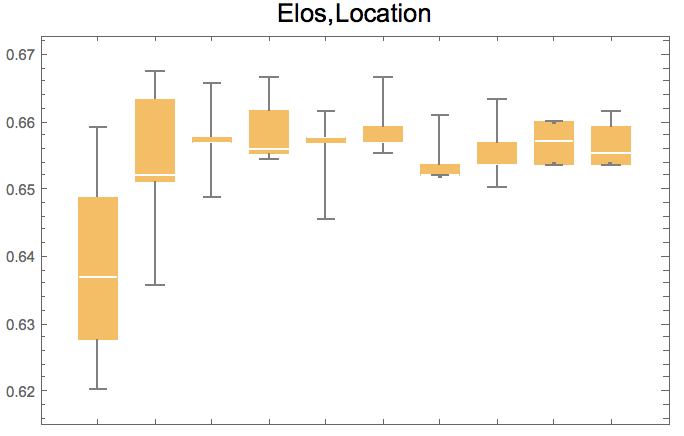
After 4 seasons, the performance no longer improved. Therefore, 4 seasons resembles a properly sized data frame for predictions without overfitting - about 5,000 games.
Conclusion
With only two variables, I was able to create an algorithm that is on par with that of top data analytics companies. While adding in tens or even hundreds of variables is tempting and may provide better results, two of the most important factors in an NBA game are the teams' respective Elo scores and the location. With these two factors alone, one can build a successful algorithm for predicting games.
Future work includes:
- Make a cloud version running online and updating automatically
- Consider other statistics - both internal and external ones. Internal statistics include a list of expected players that will play along with their individual efficiencies. External statistics include accounting for injured players, resting players, players on a minutes restriction and back to back games.
- Replacement for moving average. Each team began each season averaging 0 in their internal stats. The first several games for each team gave volatile averages which resulted in some inaccuracy. Finding a solution could prove to improve the algorithmic performance.


