Message Boards Message Boards

0
|
4022 Views
|
3 Replies
|
2 Total Likes
View groups...
Share
Share this post:

Set ListLogPlot labels?

I've made a graph using Mathematica. Here is an example of the code:

ListLogPlot[{2.7181\[CenterDot]10^7, 2.65025\[CenterDot]10^7, 
 2.16187\[CenterDot]10^7, 1.75271\[CenterDot]10^7, 
 1.38775\[CenterDot]10^7, 4.5853\[CenterDot]10^6, 
 4.1939\[CenterDot]10^6, 3.19263\[CenterDot]10^6, 
 2.85248\[CenterDot]10^6, 2.60797\[CenterDot]10^6, 
 2.38964\[CenterDot]10^6, 2.10467\[CenterDot]10^6, 
 2.01396\[CenterDot]10^6, 1.95501\[CenterDot]10^6, 
 1.89437\[CenterDot]10^6, 1.83573\[CenterDot]10^6, 
 1.80379\[CenterDot]10^6, 1.72423\[CenterDot]10^6}-> Table[iter, {iter, 1, 18}], Mesh -> All,
  Joined -> True, PlotTheme -> "Detailed", InterpolationOrder -> 1, 
 MeshStyle -> Directive[PointSize[Large], Darker[Blue]], 
 PlotRange -> {{0.5, 18.5}, {1*10^\!\(TraditionalForm\`6\), 
    5*10^\!\(TraditionalForm\`7\)}}, 
 FrameLabel -> {"Iteration number", "\[CapitalPhi](d) (euros)"}, 
 Filling -> Bottom, PlotStyle -> "Aquamarine"]

ListLogPlot

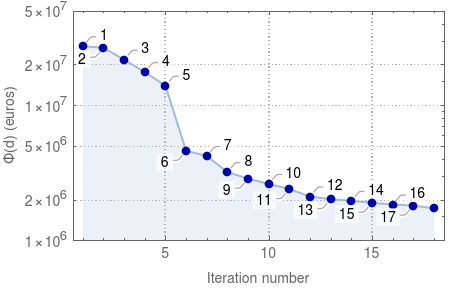
However, the last point hasn't been labeled with "18". Does anyone know how can I fix this?

Thank you in advance for any help!

3 Replies

Thank you both Claudio and Rohit for your help! I will try your solutions

Posted 5 years ago

David,

If you want more control over the appearance try Callout.

data = {2.7181*10^7, 2.65025*10^7, 2.16187*10^7, 1.75271*10^7, 
  1.38775*10^7, 4.5853*10^6, 4.1939*10^6, 3.19263*10^6, 2.85248*10^6, 
  2.60797*10^6, 2.38964*10^6, 2.10467*10^6, 2.01396*10^6, 
  1.95501*10^6, 1.89437*10^6, 1.83573*10^6, 1.80379*10^6, 1.72423*10^6}

ListLogPlot[
 Table[Callout[data[[i]], i, Appearance -> "CurvedLeader", 
   Background -> Yellow, CalloutStyle -> Red, 
   LabelStyle -> {10, Bold}], {i, 1, 18}], 
 MeshStyle -> Directive[PointSize[Large], Darker[Blue]], Mesh -> All, 
 Joined -> True, PlotRange -> {{0.5, 18.5}, {10^6, 5*10^7}}, PlotTheme -> "Detailed", 
 FrameLabel -> {"Iteration number", "\[CapitalPhi](d) (euros)"} , 
 Filling -> Bottom, PlotStyle -> "Aquamarine", ImageSize -> Large]

enter image description here

POSTED BY: Rohit Namjoshi

I added in the plot ImageSize-> Large and for me appeared all points. Interesting that without adding this, the value that does not appear to me is the 16.

Without adding ImageSize:

imag1

With ImageSize-> Large :

ListLogPlot[{2.7181*10^7, 2.65025*10^7, 
    2.16187*10^7, 1.75271*10^7, 
    1.38775*10^7, 4.5853*10^6, 
    4.1939*10^6, 3.19263*10^6, 
    2.85248*10^6, 2.60797*10^6, 
    2.38964*10^6, 2.10467*10^6, 
    2.01396*10^6, 1.95501*10^6, 
    1.89437*10^6, 1.83573*10^6, 
    1.80379*10^6, 1.72423*10^6} -> Table[iter, {iter, 1, 18}], 
 Mesh -> All,
   Joined -> True, PlotTheme -> "Detailed", InterpolationOrder -> 1, 
  MeshStyle -> Directive[PointSize[Large], Darker[Blue]], 
  PlotRange -> {{0.5, 18.5}, {1*10^\!\(TraditionalForm\`6\), 
        5*10^\!\(TraditionalForm\`7\)}}, 
  FrameLabel -> {"Iteration number", "\[CapitalPhi](d) (euros)"}, 
  Filling -> Bottom, PlotStyle -> "Aquamarine", ImageSize -> Large]

imag2

POSTED BY: Claudio Chaib
Reply to this discussion
Community posts can be styled and formatted using the Markdown syntax.
Reply Preview
Attachments
Remove
or Discard

Group Abstract Group Abstract