Traffic algorithms are something I got interested in the past year. This is because I started to drive. Before I had started driving, I did not understand why my parents couldnt drive a little faster to our destination. I felt that it would be amusing to experiment and visualize what happens at a four-way intersection with different traffic flow.
When brainstorming what I could do to start off this project, I was informed of this neat cellular automata rule, Rule 184. This rule was a great visualizer of traffic flow because it showed how the moving and stopping of individual cars impacted the traffic flow as a whole.
A problem which arose when experimenting and potentially implementing the Wolfram function into my project was that it was hard to add additional functions to the cellular automata to simulate the rules of an intersection.
Moving on from this approach, I decided to create my own function which resembled Rule 184. Creating my own function with lots of variabilities allowed me to have flexibility when experimenting with different types of traffic intersections.
First off, I created a visualizer of groups of cars stopping when it comes to an intersection.
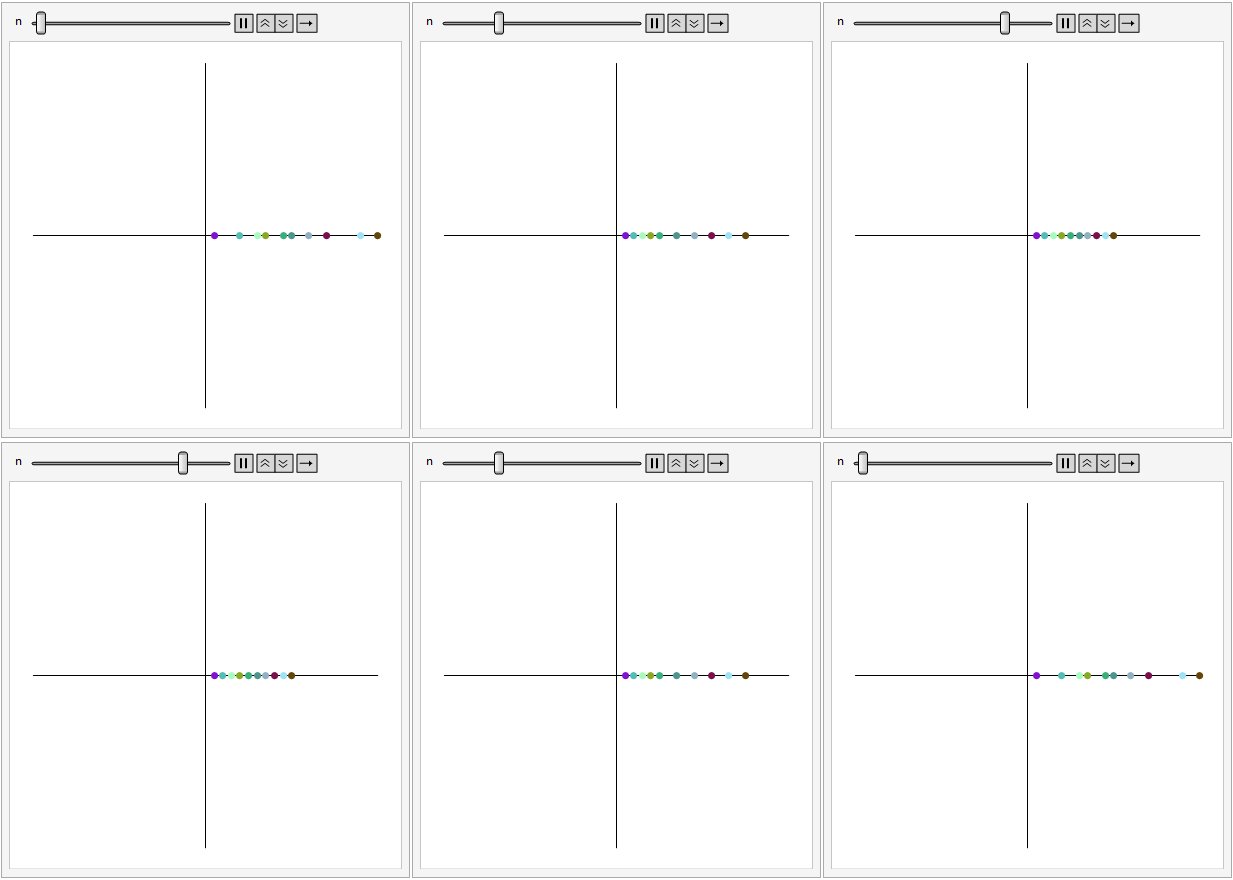
Because I represented individual cars as points with its own randomly generated color, I had to loop through individual positions on the coordinate grid and check if the next spot was an integer, 0.
After I had cars stopping the intersection, I created rules for cars yielding to traffic.
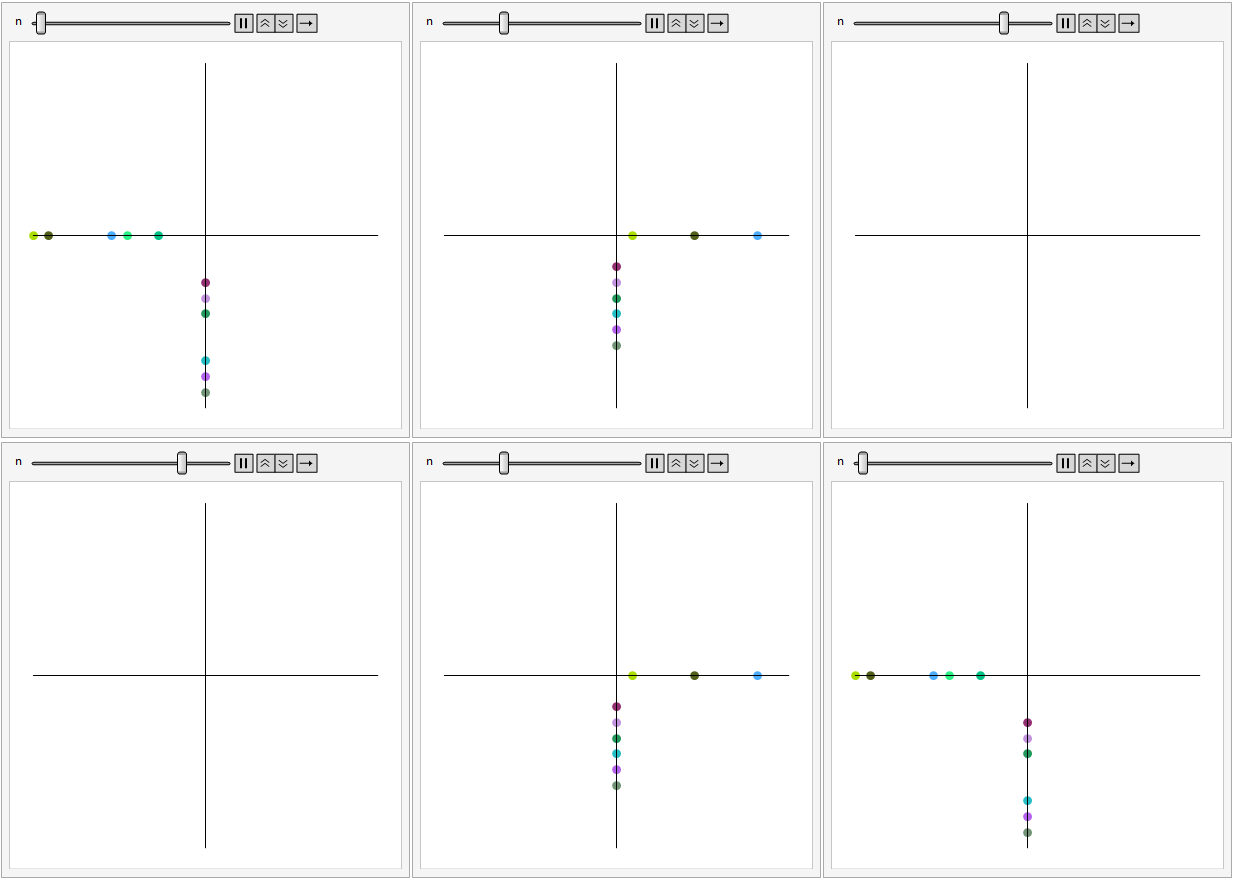
This first full intersection I created had the y-axis cars yielding to traffic in the x-axis, a representation of a side road(y-axis) meeting the main road(x-axis). Even though this intersection was incredibly efficient with the cars driving on the main road, it posed a problem when there was an infinite flow of traffic, when there was no chance for cars on the y-axis to cross.
To solve this problem, I took the obvious step of having the two flows of traffic-alternate at the intersection. I later called this waffling, a term inspired by Ms. Haas when she described the alternating cars at the intersection.
If[Length[carsInIntersection] == 0,
  If[Length[carsAtStopSign] != 0,
   If[Length[carsAtStopSign ] == 1,
    If[carsAtStopSign[[1, 1, 1, 2]] == 0,
     cloneX[[carsBehindStop + 1]] = listX[[carsBehindStop]];
     cloneX[[carsBehindStop]] = 0;
     cloneX[[carsBehindStop + 1, 1, 1, 1]]++;,
     cloneY[[carsBehindStop + 1]] = listY[[carsBehindStop]];
     cloneY[[carsBehindStop + 1, 1, 1, 2]]++;
     cloneY[[carsBehindStop]] = 0;],
    If[waffle, cloneX[[carsBehindStop + 1]] = listX[[carsBehindStop]];
      cloneX[[carsBehindStop]] = 0;
     cloneX[[carsBehindStop + 1, 1, 1, 1]]++;,
     cloneY[[carsBehindStop + 1]] = listY[[carsBehindStop]];
     cloneY[[carsBehindStop + 1, 1, 1, 2]]++;
     cloneY[[carsBehindStop]] = 0;]; waffle = ! waffle]]
  ];
Above is the code I used to "waffle". I incorporated a boolean variable which switches back and forth every time two cars are behind an intersection. This allows the traffic flow for the two axes to alternate.
Since I wanted a steady flow of traffic for this intersection, I created a function which generated cars at set intervals.
pushCarX[list_, interval_] :=
 If[Mod[iterationCount, interval] == 0 && IntegerQ[cloneX[[1]]],
  cloneX[[1]] = Style[Point[{-11, 0}], RandomColor[]]]
To analyze the data for I collected, I implemented code to count the number of cars crossed by the intersection. I plotted this graph on a graph.
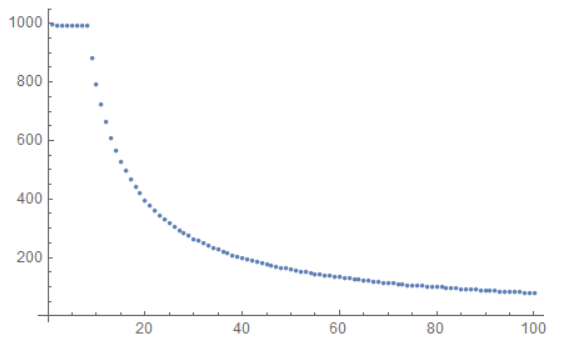
I also generated a graph for the theoretical amount of cars which should've been able to pass the intersection if the intersection wasn't present.
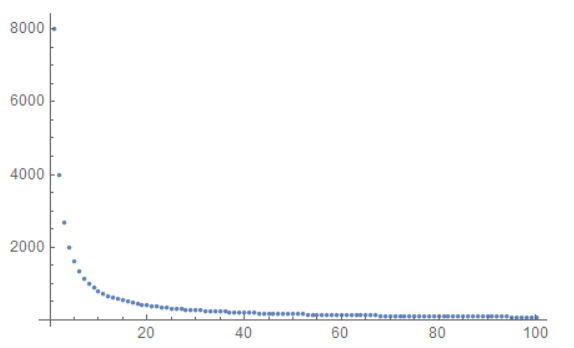
I divided the values of the two graphs to see the percentage of cars which passed the intersection compared to the theoretical amount. I plotted this on a graph shown below.
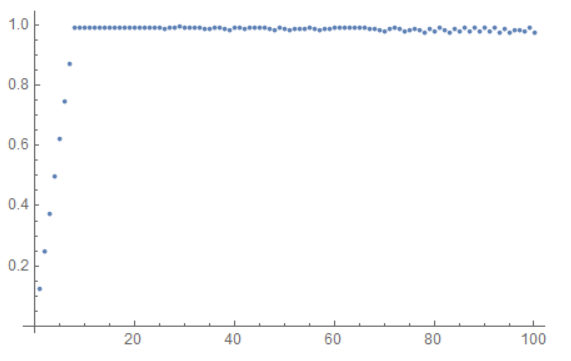
The graph shows that there is a linear relationship between the interval of cars coming to the intersection and the percentage of cars leaving the intersection. After 8 intervals, all of the cars tend to cross the intersection without stacking traffic.
https://github.com/gomgom03/WolframSCProject