
Background
Routers connect computer networks together and send packets to the correct location. In computer networks, packets make multiple hops to different locations in order to reach their destination. The router determines how to send the packets based on the destination IP address. An IP address is an address that is assigned to each device connected to a computer network and allows for identification and communication. Public IP addresses have a geolocation associated with them that we can look up, although they are not always entirely accurate.
A routing algorithm is used in order to determine the path that will be taken in order to reach a destination effectively based on a variety of factors such as distance and network traffic. Our project uses the ping time?the round-trip time taken for a packet to go to and from your destination? in order to determine the optimal route.
Project Description
This project finds the route traveled by a packet as it makes its way to a given domain. The traceroute command was used in order to gather this data on various websites from across the globe. We could extract information about how long it took to receive a response from the servers as well as the IPv4 addresses of where our packets went. This data was then cleaned and formatted for use in visualizing a map of the results. Furthermore, a graph was created based off of these results with the nodes set to the unique locations visited by the packets and the edges weighted by the average ping time. Based off of these ping times, I found optimal routes to destinations.
Functions
This function uses traceroute on a given domain and formats in into a list of associations.
getRoute[domain_] :=
(
      rawoutput = RunProcess[{"tracert", domain}];formatted = StringSplit[(StringSplit[rawoutput["StandardOutput"],"\r\n"][[4;;]] // StringTrim),
      "       " |"     "|"    " |"   " | "  "][[;;-3]];
      associations = Table[AssociationThread[{"index", "time1", "time2", "time3", "ip"} -> Table[formatted[[m, n]], {n, 1, 5}]], {m, 1, formatted//Length}];
      regexIPPattern="((25[0-5]|2[0-4][0-9]|[01]?[0-9][0-9]?)\\.(25[0-5]|2[0-4][0-9]|[01]?[0-9][0-9]?)\\.(25[0-5]|2[0-4][0-9]|[01]?[0-9][0-9]?)\\.(25[0-5]|2[0-4][0-9]|[01]?[0-9][0-9]?))";
      pingFormat = ___~~DigitCharacter~~___~~" ms";
      Function[u,<|"Index"-> u["index"],
          "Time1"->If[StringContainsQ[u["time1"], pingFormat],Quantity[First@StringCases[u["time1"],DigitCharacter..],
          "Milliseconds"],Missing["NotAvailable"]],
          "Time2"->If[StringContainsQ[u["time2"], pingFormat],Quantity[First@StringCases[u["time2"],DigitCharacter..],
          "Milliseconds"],Missing["NotAvailable"]],
          "Time3"->If[StringContainsQ[u["time3"], pingFormat],Quantity[First@StringCases[ u["time3"],DigitCharacter..],
          "Milliseconds],Missing["NotAvailable"]],
          "IP" -> With[{match=StringCases[u["ip"],RegularExpression[regexIPPattern]->"$1"]},If[match==={},Missing["NotAvailable"],
          Entity["IPAddress",First[match]]]
      ]
|>]/@associations)
This function cleans the data of missing IP addresses and timed out responses.
cleanResults[resultVar_]:=Cases[#,<|"Index"-> _,"Time1"-> _Quantity,"Time2"-> _Quantity,"Time3"-> _Quantity,"IP"-> _Entity|>]&/@resultVar
This function extracts the location, in coordinates, and the average ping time, in milliseconds, from each hop in every route. If an IP address does not have a location associated with it, I don't use it in our data.
GetLocationAndMeanTime[results_] :=
    (Function[v, {First[v], v[[2]], Last[v]}] /@
    DeleteCases[Function[u, {Mean[ToExpression /@ QuantityMagnitude[Take[u, 3]]],
        u[[4]][EntityProperty["IPAddress", "HostCoordinates"]], u[[4]]}] /@
            Lookup[#, {"Time1", "Time2", "Time3", "IP"}], {_, _Missing, _}]) & /@ results
The functions below plot assist in plotting the routes on a map. The colors of the routes depend on the relative ping times and I use the color schemes found in the Wolfram Language.
GenerateElementGeoPaths[locationAndMeansElement_, colorFunction_] :=
  Flatten[Function[v, Function[u,
        {{GeoMarker[u[[2, 2]],
          Graphics[Disk[]],
          "Scale" -> Scaled[0.015],
          "Color" -> colorFunction[u[[2, 1]]]]},
        {Thickness[0.0008], colorFunction[u[[2, 1]]],
          GeoPath[{u[[1, 2]], u[[2, 2]]}, "Geodesic"]}}] /@ Partition[v, 2, 1]] /@ locationAndMeansElement, 1]

GenerateGeoPaths[locationAndMeans_, colorScheme_] := Block[{
  minmax, colorFunc
  },
  minmax = MinMax[Flatten[locationAndMeans, 2][[All, 1]]];
  colorFunc = ColorData[{colorScheme, minmax}];

  Flatten[GenerateElementGeoPaths[#, colorFunc] & /@ locationAndMeans, 1]
]
generateGraphs creates a graph where each unique location reached by traceroute is denoted by a node, and the edges are weighted by ping times. Coordinates are represented by the nearest city or area of population.
generateGraphs[locationAndMeans_] := Block[{
    locations, pingTimes, uniqueLocations, locationstoNum
  },
  locations = (Flatten[locationAndMeans, 1])[[All, All, 2]];
  pingTimes = Flatten@(Rest /@ (Flatten[locationAndMeans, 1])[[All, All, 1]]);
  uniqueLocations = DeleteDuplicates@(Flatten[(Flatten[locationAndMeans, 1])[[All, All, 2]], 1]);
  locationstoNum = Table[
    First@Replace[locations[[m , n]], locations[[m , n]] -> First@Position[uniqueLocations, locations[[m , n]]]],
    {m, Length@locations}, {n, Length@locations[[m]]}
    ];
  nearestCities = Table[GeoNearest[Entity["City"], GeoPosition[uniqueLocations[[i]]]], {i, uniqueLocations // Length}];
  graphedRoutes = Graph[
    Flatten[Table[Table[locationstoNum[[a, b]] -> locationstoNum[[a, b + 1]], {b, (locationstoNum[[a]] // Length) - 1}], {a, locationstoNum // Length}]],
    EdgeWeight -> pingTimes,
    VertexLabels -> Table[i -> Placed[nearestCities[[i]], Top], {i, uniqueLocations // Length}],
    VertexLabelStyle -> Directive[White, 9],
    VertexSize -> 0.2,
    EdgeStyle -> {Directive[Green, Arrowheads[.008]], (1 -> 1) -> Opacity[0.125]},
    Background -> Black]
  ];
shortestPath returns the optimal locations a packet will go through in order to receive its destination. The input argument is a website link, which can be converted into an IP Address. After converting the IP address into coordinates, we then find the nearest city to it in the list of cities, nearestCities, that was developed in the generateGraphs function.
shortestPath[website_] := Block[{
    destination, nearestCity, f
  },
  destination = GeoPosition[Entity["IPAddress", (First@First@HostLookup[website])]["HostCoordinates"]];
  nearestCity = First@GeoNearest[Flatten@nearestCities, destination];
  f[i_] := (nearestCities)[[i]];
  Flatten@(f /@ FindShortestPath[graphedRoutes, 1, First@First@Position[Flatten@nearestCities, nearestCity]])
  ]
Collecting Data
The first step was gathering data. I found popular websites from around the world and performed traceroute on them in order to see how our packets will end up there and saved the results to a file.
resultsA =
  getRoute /@ {"labanquepostale.fr", "lemonde.fr", "lefigaro.fr",
    "purepeople.com", "marca.com", "elmundo.es", "elpais.com",
    "milanucios.com", "pasion.com", "caixabank.es",
    "mercadolibre.com.mx", "caliente.mx", "animeflv.net", "unam.mx",
    "www.gob.mx", "commbank.com.au", "bom.gov.au", "seek.com.au",
    "woolworths.com.au", "carsales.com.au", "google.ca", "amazon.ca",
    "kijiji.ca", "cbc.ca", "desjardins.ca", "canada.ca", "youm7.com",
    "souq.com", "masrawy.com", "yallakora.com", "filgoal.com",
    "hkjc.com", "lihkg.com", "on.cc", "discuss.com.hk",
    "ulifestyle.com.hk", "baidu.com", "alibaba.com", "taobao.com",
    "qq.com", "bilibili.com" , "google.com", "youtube.com",
    "facebook.com", "amazon.com", "yahoo.com", "twitter.com",
    "ebay.com", "instagram.com", "wikipedia.org", "flipkart.com",
    "cricbuzz.com", "xbombo.com", "indiatimes.com", "news18.com",
    "flipkart.com", "cricbuzz.com", "xbombo.com", "indiatimes.com",
    "news18.com", "yad2.co.il", "zap.co.il", "bankhapoalim.co.il",
    "newsru.co.il", "sport5.co.il", "afip.gob.ar", "lanacion.com.ar",
    "bbva.com.ar", "bancogalicia.com.ar", "hollywoodbets.net",
    "tubidy.mobi", "mtn.co.za", "iol.co.za", "uol.com.br",
    "bet365.com", "americanas.com.br", "kooora.com", "www.men.gov.ma"};

resultsB =
  getRoute /@ { "hespress.com", "friend.com.kp", "ma.gov.kp",
    "airkoryo.com.kp", "nta.gov.kp", "ryongnamsan.edu.kp",
    "cooks.org.kp", "sdprk.org.kp", "gnu.rep.kp", "korfilm.com.kp",
    "yandex.ru", "ok.ru", "avito.ru", "gismeto.ru", "wildberries.ru",
    "drom.ru", "haraj.com.sa", "starzplay.com", "cimaclub.com",
    "moi.gov.sa", "souq.com", "vnexpress.net", "zing.vn",
    "24h.com.vn", "kenh14.vn", "shopee.vn", "baomoi.com",
    "ehawaii.gov", "webmasterserviceshawaii.com", "manoa.hawaii.edu",
    "alaska.gov", "adn.com", "uaf.edu", "alaskawildlife.org",
    "detik.com", "shopee.co.id", "bukalapak.com", "kompas.com",
    "sermitsiaq.ag", "banken.gl", "tusass.gl",  "eltiempo.com",
    "computrabajo.com.co", "caracoltv.com", "canalrcn.com",
    "elcomercio.pe", "www.sunat.gob.pe",
    "mercadolibre.com.pe", "larepublica.pe", "www.viabcp.com",
    "ouedkniss.com"};

resultsC =
  getRoute /@ {"ency-education.com", "startimes.com", "elkhabar.com",
    "trademe.co.nz", "stuff.co.nz", "nzherald.co.nz", "ird.govt.nz",
    "bet9ja.com", "jumia.com.ng", "nairaland.com", "betradar.com",
    "ghanaweb.com", "lightdl.xyz", "ug.edu.gh", "nss.gov.gh",
    "yandex.uz", "mover.uz", "olx.uz", "gov.uz", "xcite.com",
    "talabat.com", "www.knetpay.com.kw",  "moi.gov.kw", "daraz.pk",
    "watchonlinemovies.com.pk", "7starhd.work", "punjab.gov.pk",
    "ukr.net", "sinoptik.ua", "rozetka.com.ua", "prom.ua", "mit.edu",
    "harvard.edu", "princeton.edu", "stonybrook.edu", "columbia.edu",
    "stanford.edu", "umich.edu", "cmu.edu", "ut.edu", "utexas.edu",
    "risd.edu", "ua.edu", "wisc.edu", "washington.edu",
    "georgetown.edu", "uchicago.edu", "cornell.edu", "berkeley.edu",
    "vanderbilt.edu", "phoenix.edu", "illinois.edu", "mines.edu",
    "umass.edu", "reddit.com", "wolfram.com", "baidu.com",
    "bbc.co.uk", "ikea.com", "mail.ru", "yahoo.co.jp",
    "minecraft.net", "github.io"};

resultsD = getRoute /@ (RandomSample[("151.101." <> ToString[#] <> ".13" &) /@ Range[255], 20]);
I saved these results to a file because the getRoute function can take time to run.
Get[(*whatever file path you put your results in*)];
totalResults = cleanResults /@ (ToExpression /@ Drop[Names["results*"], 1]);
locationAndMeans = GetLocationAndMeanTime /@ totalResults;
Visualizing our Data
I generated a map with the locations plotted and connected to each other.
GeoGraphics[{{GeoStyling["OutlineMap",
    Directive[Black,
    EdgeForm[Directive[{Thin, Opacity[0.75], Green}]]]],
  Polygon[{EntityClass["Country", "Countries"],
    Entity["AdministrativeDivision", {"Alaska", "UnitedStates"}],
    Entity["GeographicRegion", "Antarctica"],
    Entity["AdministrativeDivision", {"Hawaii",
      "UnitedStates"}]}]}, {GenerateGeoPaths[locationAndMeans,
    "NeonColors"]}}, GeoCenter -> Here, GeoZoomLevel -> 3,
GeoBackground -> LinearGradientImage[{Black, Blue, Black}]]
The greener colors represent faster ping times, while the red ping times are slower.
I also generated a directed graph where locations of routers are represented by nodes. Graphs allow us to run shortest path algorithms and also allow for an interesting alternative visualization of the networks.
generateGraphs[locationAndMeans]

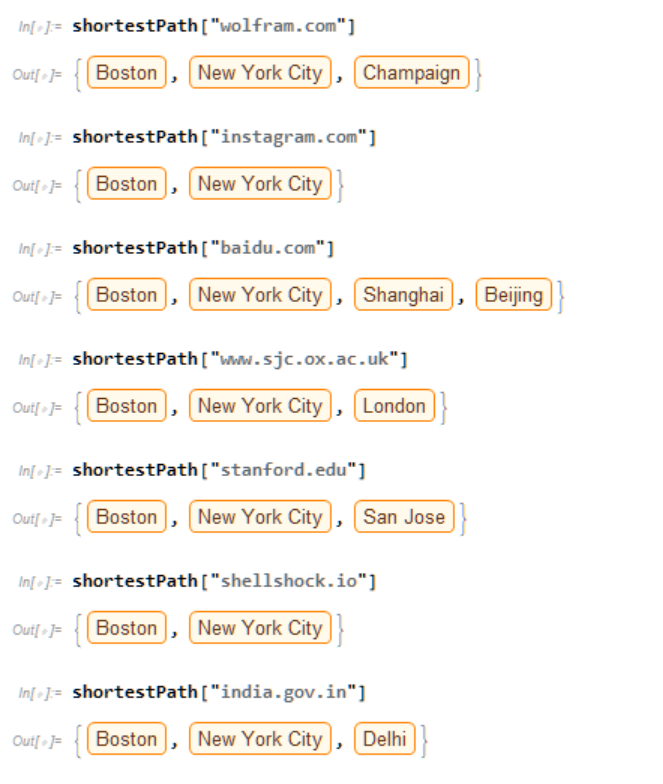 Here are some examples of the shortest route required to reach a domain from my current location.
Limitations
There are many limitations with our results that prevent them from being fully accurate.
For example, the coordinates associated with an IP Address does not always give us an accurate approximation of the host location. Also, on some hops, the nodes did not provide us with an IP Address, and consequently, they could not be used in our dataset. Additionally, in order to find the most efficient route, our algorithm relies on the current data I have already gathered, which raises the need for potentially crowdsourcing more data from the public.
Future Work
Potential future results include the implementation of this project in different geolocations in order to gather information and see how packets travel from different parts of the world. This could be accomplished through crowdsourcing data from people of different parts of the world. I could also compare the optimal theoretical routes to the ones that exist in real life and examine the feasibility of implementing theoretical routes in order to design more efficient network systems.
Acknowledgements
I would like to thank Christian Pasquel, my mentor, for guiding and assisting me in the development of this project.
https://github.com/aaieiu/WSS-Template


